29
/
en
AIzaSyAYiBZKx7MnpbEhh9jyipgxe19OcubqV5w
April 1, 2024
70080
Argentina
ARG
true
2
1
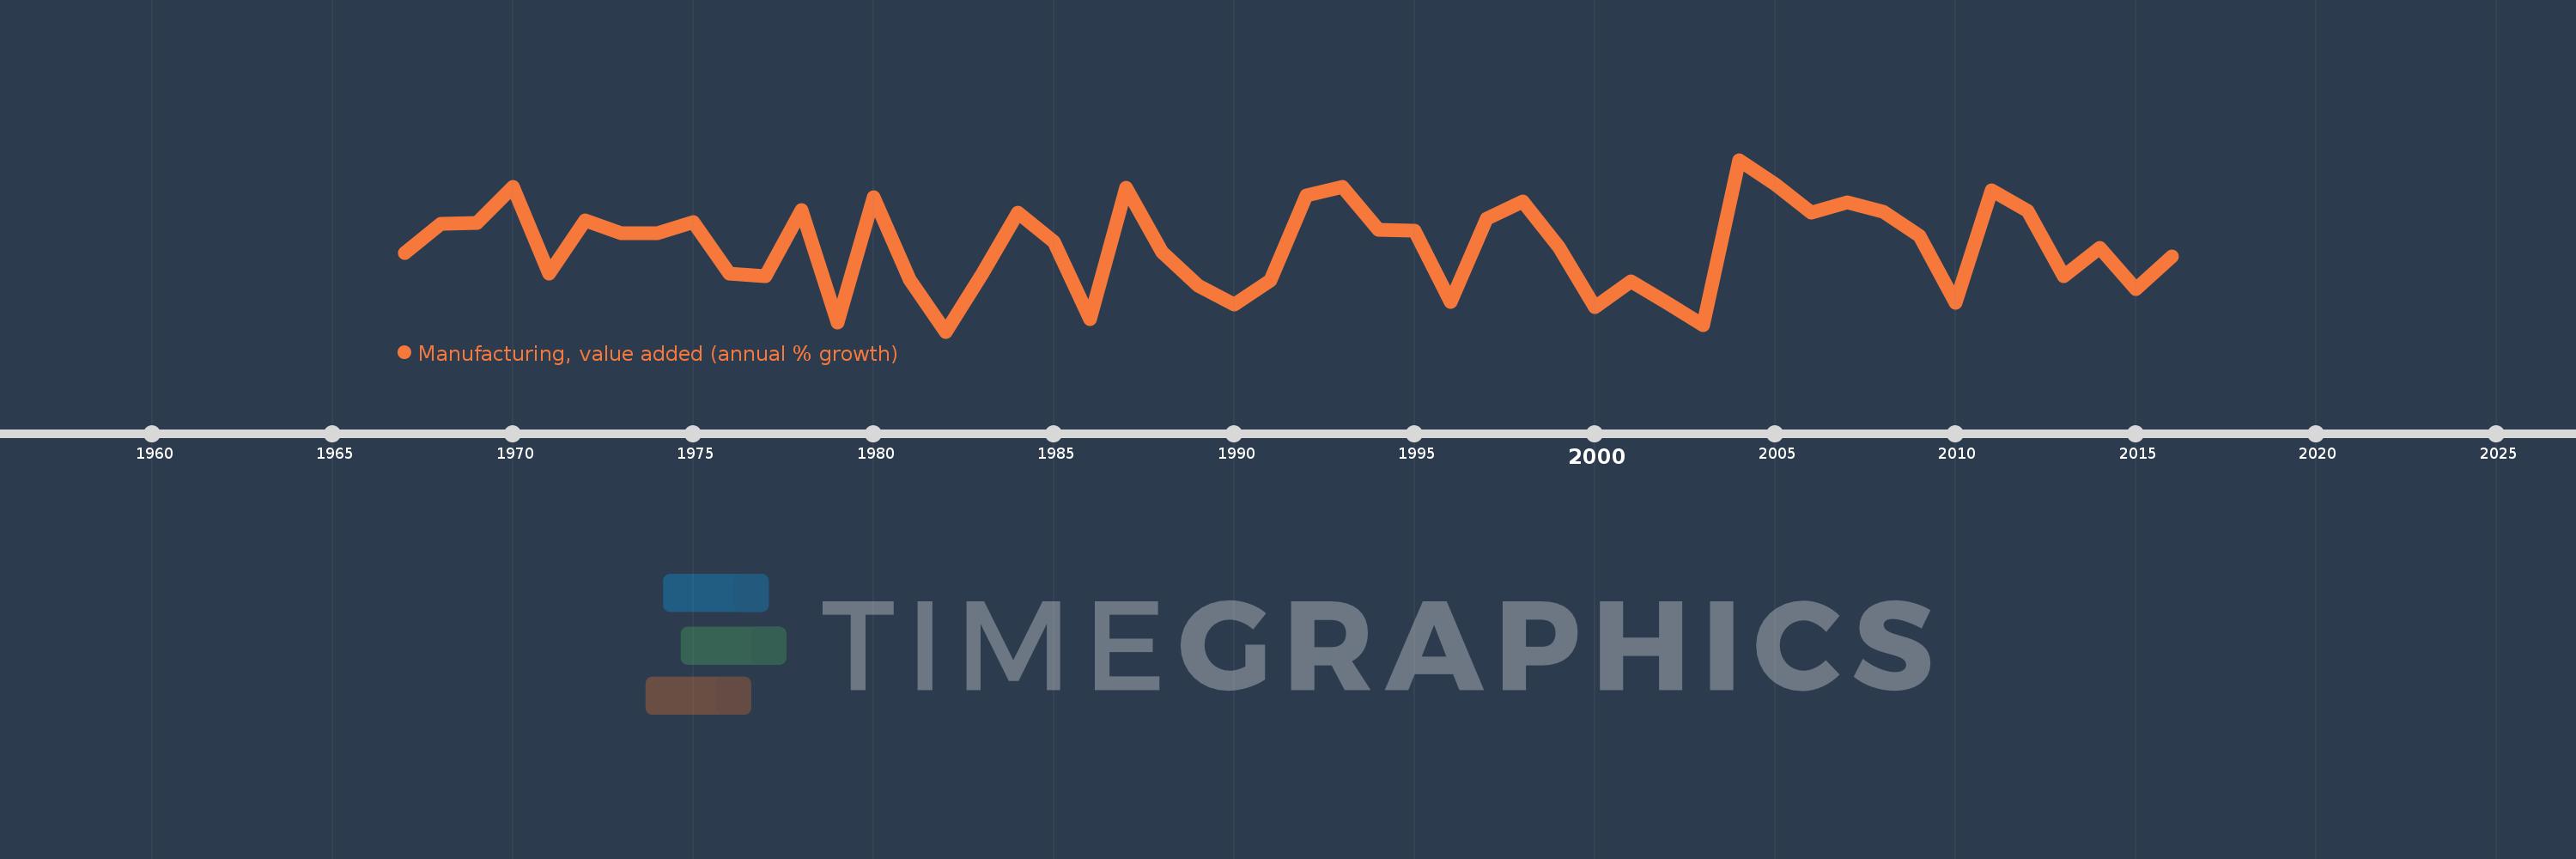
Manufacturing, value added (annual % growth)
2016,2015,2014,2013,2012,2011,2010,2009,2008,2007,2006,2005,2004,2003,2002,2001,2000,1999,1998,1997,1996,1995,1994,1993,1992,1991,1990,1989,1988,1987,1986,1985,1984,1983,1982,1981,1980,1979,1978,1977,1976,1975,1974,1973,1972,1971,1970,1969,1968,1967
This statistics in other country:
AfghanistanAlbaniaAlgeriaAntigua and BarbudaArab WorldArgentinaArmeniaAustraliaAustriaAzerbaijanBahamas, TheBahrainBangladeshBelarusBelgiumBelizeBeninBermudaBhutanBoliviaBosnia and HerzegovinaBotswanaBrazilBrunei DarussalamBurkina FasoBurundiCabo VerdeCambodiaCameroonCanadaCaribbean small statesCayman IslandsCentral African RepublicCentral Europe and the BalticsChadChileColombiaComorosCongo, Dem. Rep.Congo, Rep.Costa RicaCote d'IvoireCroatiaCubaCyprusCzech RepublicDenmarkDjiboutiDominicaDominican RepublicEarly-demographic dividendEcuadorEgypt, Arab Rep.El SalvadorEquatorial GuineaEritreaEstoniaEthiopiaEuro areaEurope & Central AsiaEurope & Central Asia (excluding high income)Europe & Central Asia (IDA & IBRD countries)European UnionFijiFinlandFragile and conflict affected situationsFranceGabonGambia, TheGeorgiaGermanyGhanaGreeceGrenadaGuatemalaGuineaGuyanaHaitiHeavily indebted poor countries (HIPC)High incomeHondurasHong Kong SAR, ChinaHungaryIcelandIDA blendIDA onlyIDA totalIndiaIndonesiaIran, Islamic Rep.IraqIrelandItalyJamaicaJapanJordanKazakhstanKenyaKiribatiKorea, Rep.KosovoKuwaitKyrgyz RepublicLao PDRLatin America & Caribbean Latin America & Caribbean (excluding high income)Latin America & the Caribbean (IDA & IBRD countries)LatviaLeast developed countries: UN classificationLebanonLesothoLiberiaLithuaniaLow incomeLower middle incomeLuxembourgMacedonia, FYRMadagascarMalawiMalaysiaMaldivesMarshall IslandsMauritaniaMauritiusMexicoMicronesia, Fed. Sts.Middle East & North AfricaMiddle East & North Africa (excluding high income)Middle East & North Africa (IDA & IBRD countries)MoldovaMongoliaMontenegroMoroccoMozambiqueMyanmarNamibiaNepalNetherlandsNew ZealandNicaraguaNigerNigeriaNorth AmericaNorwayOECD membersOmanOther small statesPacific island small statesPakistanPalauPanamaPapua New GuineaParaguayPeruPhilippinesPolandPortugalPost-demographic dividendPre-demographic dividendPuerto RicoQatarRomaniaRussian FederationRwandaSamoaSao Tome and PrincipeSaudi ArabiaSenegalSerbiaSeychellesSierra LeoneSingaporeSlovak RepublicSloveniaSmall statesSolomon IslandsSomaliaSouth AfricaSouth AsiaSouth Asia (IDA & IBRD)SpainSri LankaSt. Kitts and NevisSt. LuciaSt. Vincent and the GrenadinesSub-Saharan Africa Sub-Saharan Africa (excluding high income)Sub-Saharan Africa (IDA & IBRD countries)SudanSurinameSwazilandSwedenSwitzerlandSyrian Arab RepublicTajikistanTanzaniaThailandTimor-LesteTogoTongaTrinidad and TobagoTunisiaTurkeyTuvaluUgandaUkraineUnited Arab EmiratesUnited KingdomUnited StatesUruguayUzbekistanVanuatuVenezuela, RBVietnamWest Bank and GazaWorldZambiaZimbabwe Timeline:
This timeline shows a graph from 1967 to 2016 of Argentina. No data until 1966. Number of actual observations by date: 50.
Source name:
World Development Indicators
Source organization:
World Bank national accounts data, and OECD National Accounts data files.
Categories, topics:
Economy & Growth
Last updated:
apr 23, 2017
Indicators value changes by year
Minimum:
-11.981
jan 1, 1982
Maximum:
15.967
jan 1, 2004
At the date of observation
Value
Absolute change
Change from previous value
jan 1, 1967
0.874
+0.874
0.0%
jan 1, 1968
5.543
+4.669
534.45%
jan 1, 1969
5.634
+0.091
1.65%
jan 1, 1970
11.548
+5.914
104.97%
jan 1, 1971
-2.572
-14.12
-122.27%
jan 1, 1972
6.166
+8.738
-339.76%
jan 1, 1973
3.995
-2.171
-35.22%
jan 1, 1974
3.966
-0.028
-0.71%
jan 1, 1975
5.874
+1.908
48.1%
jan 1, 1976
-2.553
-8.427
-143.46%
jan 1, 1977
-3.034
-0.481
18.84%
jan 1, 1978
7.814
+10.847
-357.56%
jan 1, 1979
-10.523
-18.336
-234.67%
jan 1, 1980
9.945
+20.467
-194.51%
jan 1, 1981
-3.56
-13.505
-135.8%
jan 1, 1982
-11.981
-8.421
236.54%
jan 1, 1983
-2.685
+9.296
-77.59%
jan 1, 1984
7.371
+10.056
-374.56%
jan 1, 1985
2.645
-4.727
-64.12%
jan 1, 1986
-9.903
-12.547
-474.45%
jan 1, 1987
11.357
+21.26
-214.69%
jan 1, 1988
0.968
-10.389
-91.48%
jan 1, 1989
-4.504
-5.472
-565.25%
jan 1, 1990
-7.603
-3.099
68.81%
jan 1, 1991
-3.699
+3.905
-51.36%
jan 1, 1992
10.235
+13.934
-376.74%
jan 1, 1993
11.576
+1.34
13.09%
jan 1, 1994
4.645
-6.93
-59.87%
jan 1, 1995
4.5
-0.146
-3.14%
jan 1, 1996
-7.165
-11.664
-259.23%
jan 1, 1997
6.452
+13.616
-190.05%
jan 1, 1998
9.151
+2.7
41.84%
jan 1, 1999
1.849
-7.303
-79.8%
jan 1, 2000
-7.929
-9.778
-528.88%
jan 1, 2001
-3.823
+4.106
-51.78%
jan 1, 2002
-7.362
-3.539
92.56%
jan 1, 2003
-10.955
-3.593
48.81%
jan 1, 2004
15.967
+26.922
-245.75%
jan 1, 2005
11.976
-3.991
-25.0%
jan 1, 2006
7.425
-4.551
-38.0%
jan 1, 2007
9.102
+1.677
22.58%
jan 1, 2008
7.541
-1.561
-17.15%
jan 1, 2009
3.631
-3.91
-51.85%
jan 1, 2010
-7.277
-10.908
-300.42%
jan 1, 2011
10.965
+18.243
-250.68%
jan 1, 2012
7.659
-3.306
-30.15%
jan 1, 2013
-2.971
-10.63
-138.78%
jan 1, 2014
1.596
+4.567
-153.72%
jan 1, 2015
-5.102
-6.698
-419.71%
jan 1, 2016
0.244
+5.347
-104.79%
Ranking of countries by current statistics by years


Comments: