29
/
en
AIzaSyAYiBZKx7MnpbEhh9jyipgxe19OcubqV5w
April 1, 2024
48295
Middle East & North Africa
MEA
false
2
1
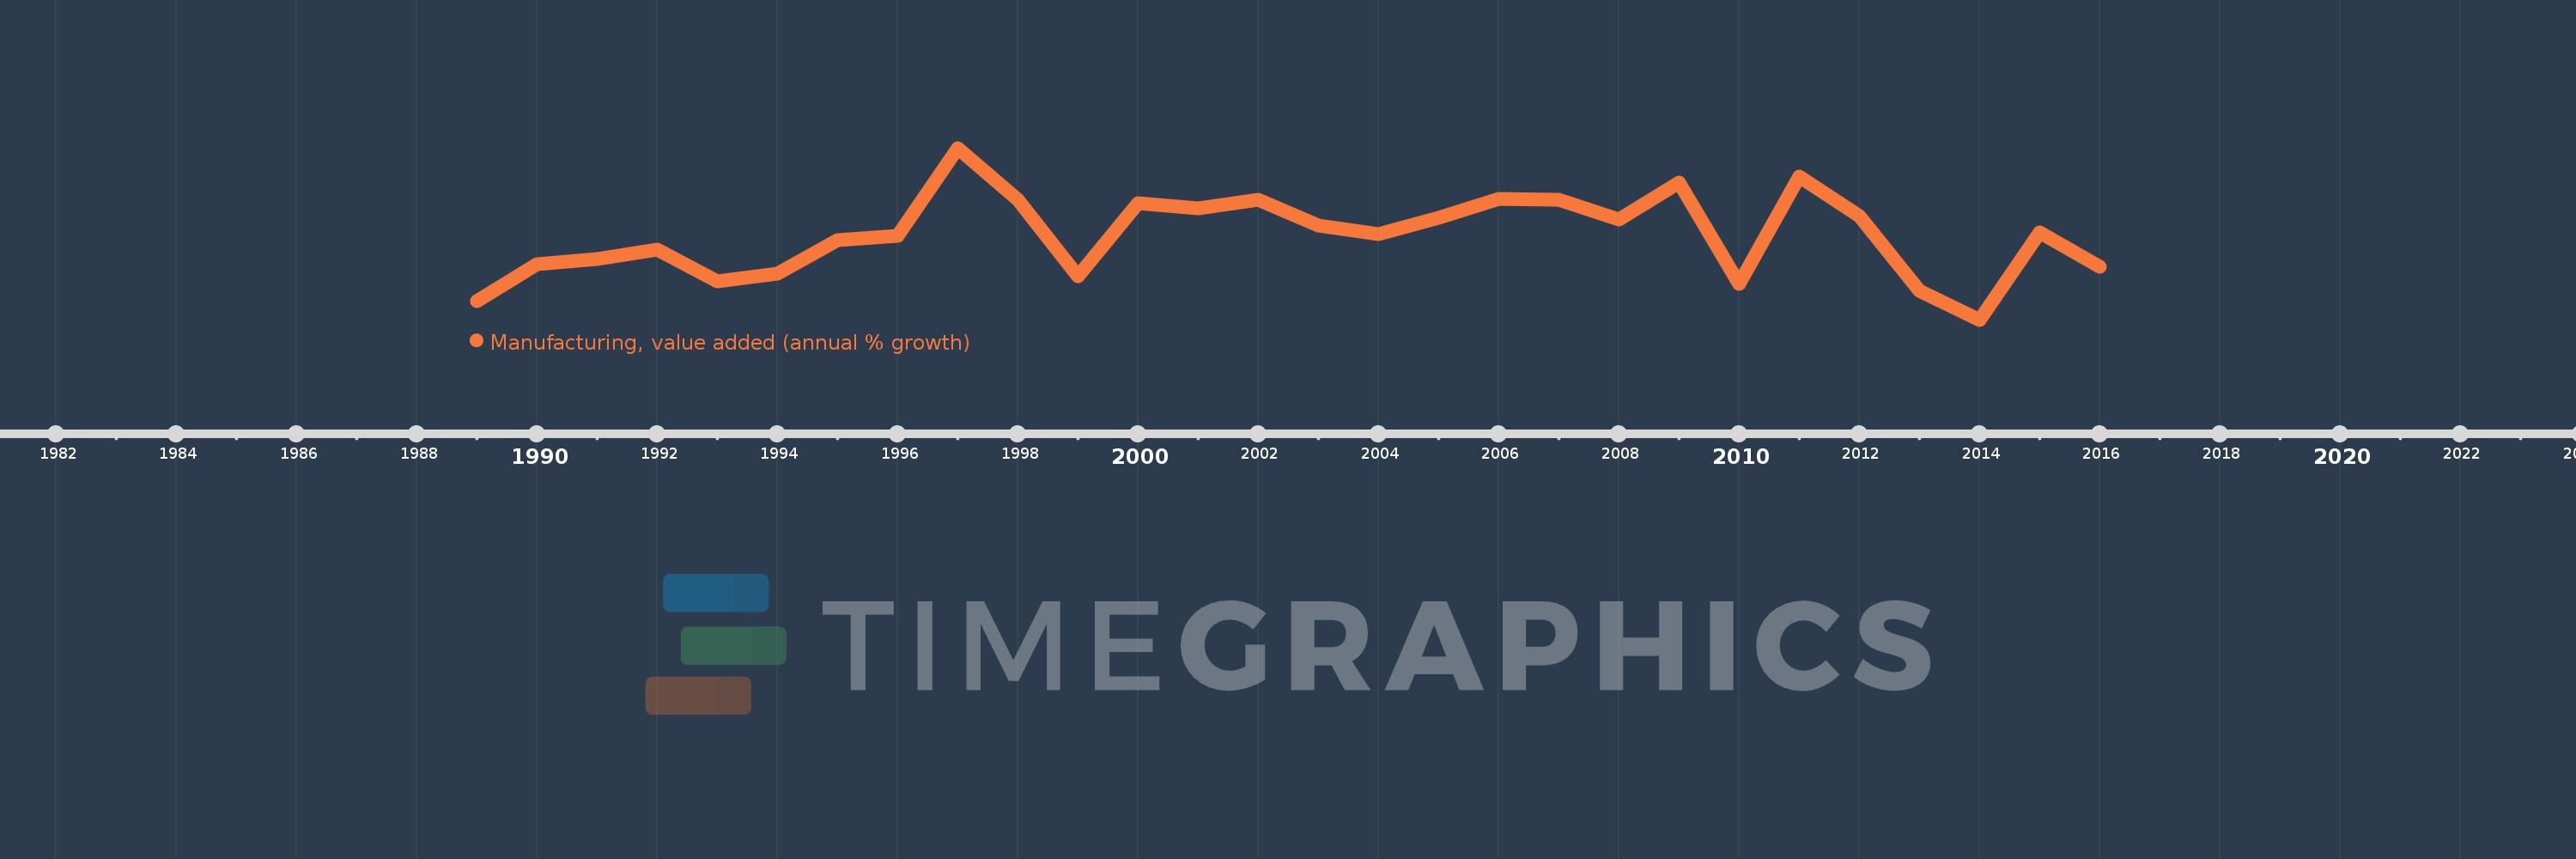
Manufacturing, value added (annual % growth)
2016,2015,2014,2013,2012,2011,2010,2009,2008,2007,2006,2005,2004,2003,2002,2001,2000,1999,1998,1997,1996,1995,1994,1993,1992,1991,1990,1989
This statistics in other country:
AfghanistanAlbaniaAlgeriaAntigua and BarbudaArab WorldArgentinaArmeniaAustraliaAustriaAzerbaijanBahamas, TheBahrainBangladeshBelarusBelgiumBelizeBeninBermudaBhutanBoliviaBosnia and HerzegovinaBotswanaBrazilBrunei DarussalamBurkina FasoBurundiCabo VerdeCambodiaCameroonCanadaCaribbean small statesCayman IslandsCentral African RepublicCentral Europe and the BalticsChadChileColombiaComorosCongo, Dem. Rep.Congo, Rep.Costa RicaCote d'IvoireCroatiaCubaCyprusCzech RepublicDenmarkDjiboutiDominicaDominican RepublicEarly-demographic dividendEcuadorEgypt, Arab Rep.El SalvadorEquatorial GuineaEritreaEstoniaEthiopiaEuro areaEurope & Central AsiaEurope & Central Asia (excluding high income)Europe & Central Asia (IDA & IBRD countries)European UnionFijiFinlandFragile and conflict affected situationsFranceGabonGambia, TheGeorgiaGermanyGhanaGreeceGrenadaGuatemalaGuineaGuyanaHaitiHeavily indebted poor countries (HIPC)High incomeHondurasHong Kong SAR, ChinaHungaryIcelandIDA blendIDA onlyIDA totalIndiaIndonesiaIran, Islamic Rep.IraqIrelandItalyJamaicaJapanJordanKazakhstanKenyaKiribatiKorea, Rep.KosovoKuwaitKyrgyz RepublicLao PDRLatin America & Caribbean Latin America & Caribbean (excluding high income)Latin America & the Caribbean (IDA & IBRD countries)LatviaLeast developed countries: UN classificationLebanonLesothoLiberiaLithuaniaLow incomeLower middle incomeLuxembourgMacedonia, FYRMadagascarMalawiMalaysiaMaldivesMarshall IslandsMauritaniaMauritiusMexicoMicronesia, Fed. Sts.Middle East & North AfricaMiddle East & North Africa (excluding high income)Middle East & North Africa (IDA & IBRD countries)MoldovaMongoliaMontenegroMoroccoMozambiqueMyanmarNamibiaNepalNetherlandsNew ZealandNicaraguaNigerNigeriaNorth AmericaNorwayOECD membersOmanOther small statesPacific island small statesPakistanPalauPanamaPapua New GuineaParaguayPeruPhilippinesPolandPortugalPost-demographic dividendPre-demographic dividendPuerto RicoQatarRomaniaRussian FederationRwandaSamoaSao Tome and PrincipeSaudi ArabiaSenegalSerbiaSeychellesSierra LeoneSingaporeSlovak RepublicSloveniaSmall statesSolomon IslandsSomaliaSouth AfricaSouth AsiaSouth Asia (IDA & IBRD)SpainSri LankaSt. Kitts and NevisSt. LuciaSt. Vincent and the GrenadinesSub-Saharan Africa Sub-Saharan Africa (excluding high income)Sub-Saharan Africa (IDA & IBRD countries)SudanSurinameSwazilandSwedenSwitzerlandSyrian Arab RepublicTajikistanTanzaniaThailandTimor-LesteTogoTongaTrinidad and TobagoTunisiaTurkeyTuvaluUgandaUkraineUnited Arab EmiratesUnited KingdomUnited StatesUruguayUzbekistanVanuatuVenezuela, RBVietnamWest Bank and GazaWorldZambiaZimbabwe Timeline:
This timeline shows a graph from 1989 to 2016 of Middle East & North Africa. No data until 1988. Number of actual observations by date: 28.
Source name:
World Development Indicators
Source organization:
World Bank national accounts data, and OECD National Accounts data files.
Categories, topics:
Economy & Growth
Last updated:
apr 23, 2017
Indicators value changes by year
Maximum:
10.094
jan 1, 1997
At the date of observation
Value
Absolute change
Change from previous value
jan 1, 1989
1.183
+1.183
0.0%
jan 1, 1990
3.324
+2.14
180.87%
jan 1, 1991
3.62
+0.296
8.91%
jan 1, 1992
4.187
+0.567
15.65%
jan 1, 1993
2.298
-1.889
-45.12%
jan 1, 1994
2.765
+0.468
20.35%
jan 1, 1995
4.721
+1.955
70.7%
jan 1, 1996
4.963
+0.243
5.14%
jan 1, 1997
10.094
+5.131
103.38%
jan 1, 1998
7.053
-3.041
-30.13%
jan 1, 1999
2.597
-4.456
-63.18%
jan 1, 2000
6.857
+4.261
164.08%
jan 1, 2001
6.593
-0.264
-3.85%
jan 1, 2002
7.075
+0.482
7.31%
jan 1, 2003
5.595
-1.48
-20.92%
jan 1, 2004
5.068
-0.526
-9.41%
jan 1, 2005
6.009
+0.941
18.57%
jan 1, 2006
7.138
+1.129
18.79%
jan 1, 2007
7.096
-0.042
-0.59%
jan 1, 2008
5.911
-1.185
-16.7%
jan 1, 2009
8.073
+2.162
36.57%
jan 1, 2010
2.155
-5.918
-73.3%
jan 1, 2011
8.435
+6.28
291.38%
jan 1, 2012
6.128
-2.307
-27.35%
jan 1, 2013
1.766
-4.362
-71.18%
jan 1, 2014
0.076
-1.69
-95.71%
jan 1, 2015
5.156
+5.08
6.7K%
jan 1, 2016
3.16
-1.995
-38.7%
Ranking of countries by current statistics by years


Comments: