29
/
en
AIzaSyAYiBZKx7MnpbEhh9jyipgxe19OcubqV5w
April 1, 2024
264853
Togo
TGO
true
2
1
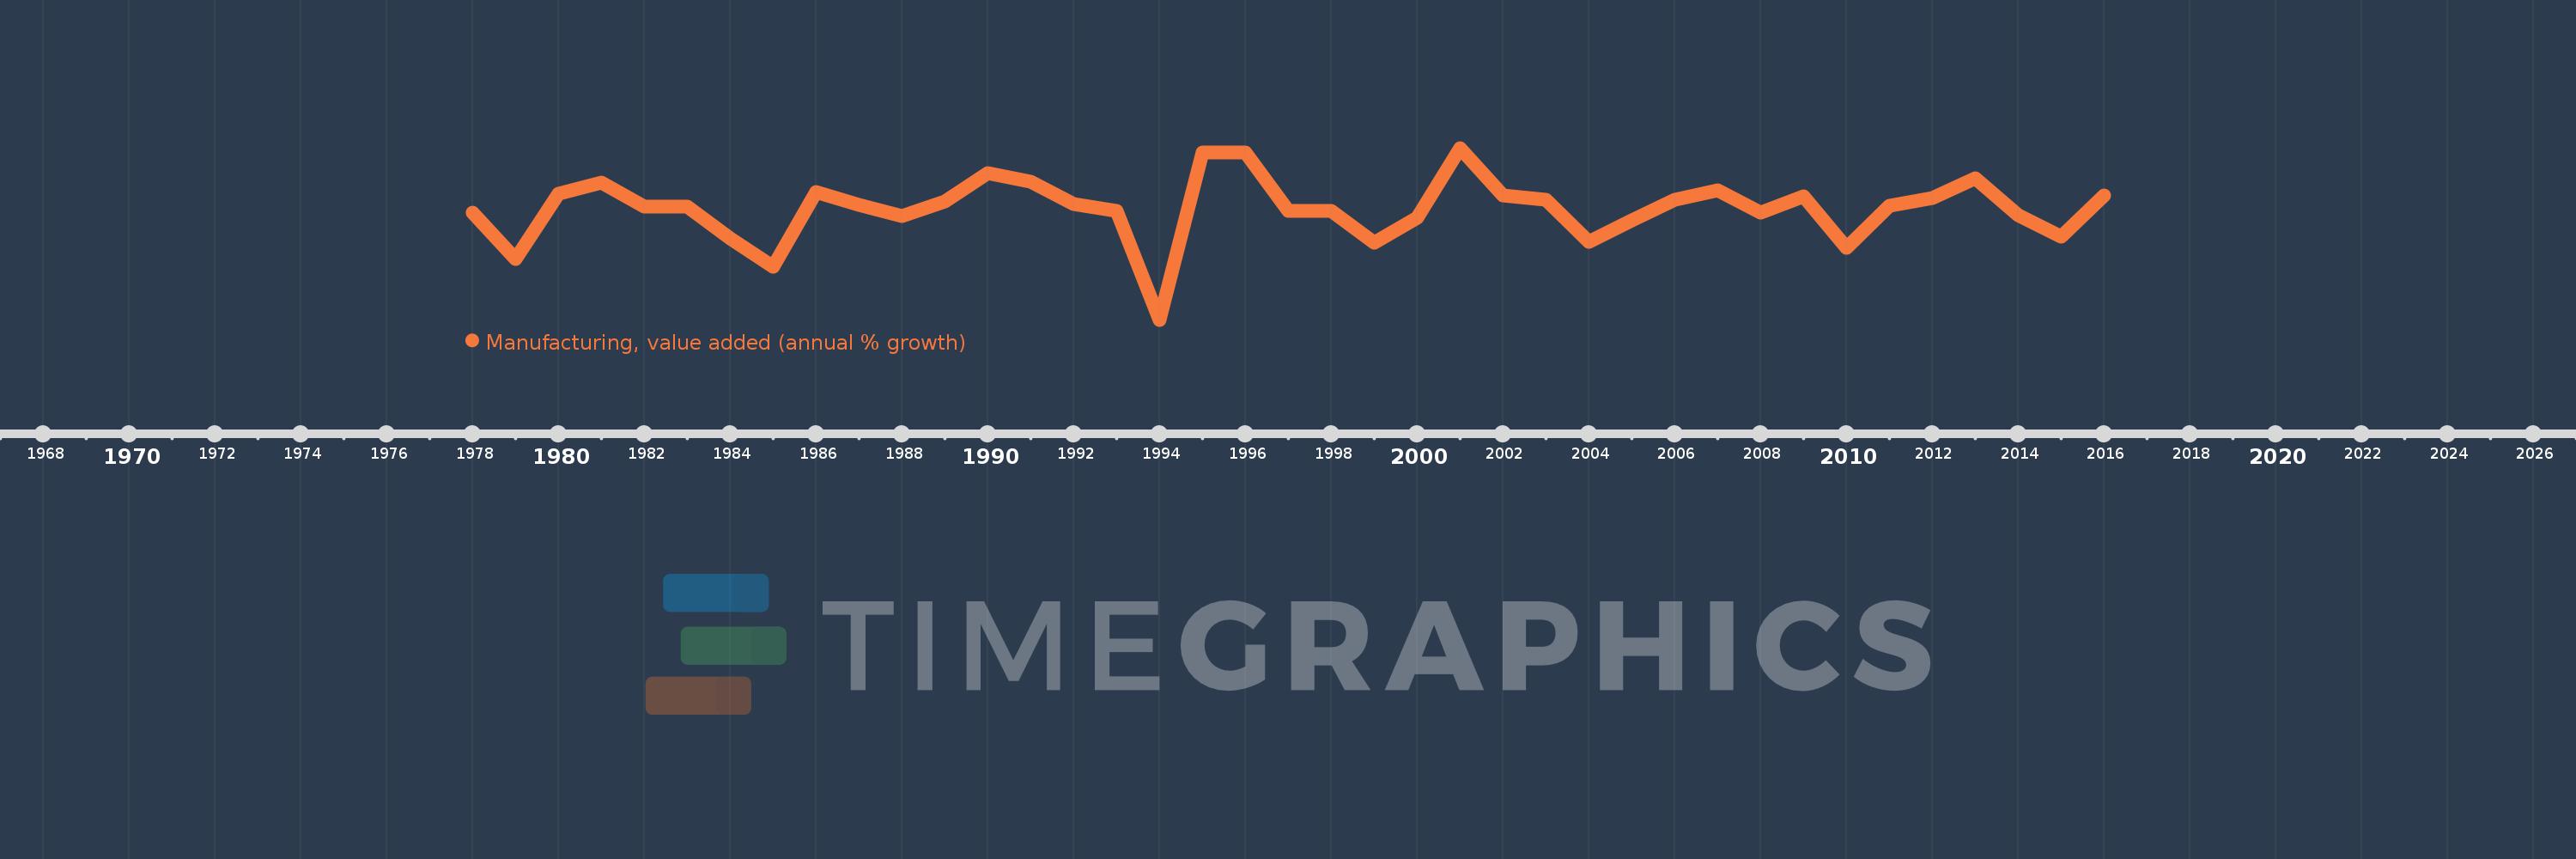
Manufacturing, value added (annual % growth)
2016,2015,2014,2013,2012,2011,2010,2009,2008,2007,2006,2005,2004,2003,2002,2001,2000,1999,1998,1997,1996,1995,1994,1993,1992,1991,1990,1989,1988,1987,1986,1985,1984,1983,1982,1981,1980,1979,1978
This statistics in other country:
AfghanistanAlbaniaAlgeriaAntigua and BarbudaArab WorldArgentinaArmeniaAustraliaAustriaAzerbaijanBahamas, TheBahrainBangladeshBelarusBelgiumBelizeBeninBermudaBhutanBoliviaBosnia and HerzegovinaBotswanaBrazilBrunei DarussalamBurkina FasoBurundiCabo VerdeCambodiaCameroonCanadaCaribbean small statesCayman IslandsCentral African RepublicCentral Europe and the BalticsChadChileColombiaComorosCongo, Dem. Rep.Congo, Rep.Costa RicaCote d'IvoireCroatiaCubaCyprusCzech RepublicDenmarkDjiboutiDominicaDominican RepublicEarly-demographic dividendEcuadorEgypt, Arab Rep.El SalvadorEquatorial GuineaEritreaEstoniaEthiopiaEuro areaEurope & Central AsiaEurope & Central Asia (excluding high income)Europe & Central Asia (IDA & IBRD countries)European UnionFijiFinlandFragile and conflict affected situationsFranceGabonGambia, TheGeorgiaGermanyGhanaGreeceGrenadaGuatemalaGuineaGuyanaHaitiHeavily indebted poor countries (HIPC)High incomeHondurasHong Kong SAR, ChinaHungaryIcelandIDA blendIDA onlyIDA totalIndiaIndonesiaIran, Islamic Rep.IraqIrelandItalyJamaicaJapanJordanKazakhstanKenyaKiribatiKorea, Rep.KosovoKuwaitKyrgyz RepublicLao PDRLatin America & Caribbean Latin America & Caribbean (excluding high income)Latin America & the Caribbean (IDA & IBRD countries)LatviaLeast developed countries: UN classificationLebanonLesothoLiberiaLithuaniaLow incomeLower middle incomeLuxembourgMacedonia, FYRMadagascarMalawiMalaysiaMaldivesMarshall IslandsMauritaniaMauritiusMexicoMicronesia, Fed. Sts.Middle East & North AfricaMiddle East & North Africa (excluding high income)Middle East & North Africa (IDA & IBRD countries)MoldovaMongoliaMontenegroMoroccoMozambiqueMyanmarNamibiaNepalNetherlandsNew ZealandNicaraguaNigerNigeriaNorth AmericaNorwayOECD membersOmanOther small statesPacific island small statesPakistanPalauPanamaPapua New GuineaParaguayPeruPhilippinesPolandPortugalPost-demographic dividendPre-demographic dividendPuerto RicoQatarRomaniaRussian FederationRwandaSamoaSao Tome and PrincipeSaudi ArabiaSenegalSerbiaSeychellesSierra LeoneSingaporeSlovak RepublicSloveniaSmall statesSolomon IslandsSomaliaSouth AfricaSouth AsiaSouth Asia (IDA & IBRD)SpainSri LankaSt. Kitts and NevisSt. LuciaSt. Vincent and the GrenadinesSub-Saharan Africa Sub-Saharan Africa (excluding high income)Sub-Saharan Africa (IDA & IBRD countries)SudanSurinameSwazilandSwedenSwitzerlandSyrian Arab RepublicTajikistanTanzaniaThailandTimor-LesteTogoTongaTrinidad and TobagoTunisiaTurkeyTuvaluUgandaUkraineUnited Arab EmiratesUnited KingdomUnited StatesUruguayUzbekistanVanuatuVenezuela, RBVietnamWest Bank and GazaWorldZambiaZimbabwe Timeline:
This timeline shows a graph from 1978 to 2016 of Togo. No data until 1977. Number of actual observations by date: 39.
Source name:
World Development Indicators
Source organization:
World Bank national accounts data, and OECD National Accounts data files.
Categories, topics:
Economy & Growth
Last updated:
apr 23, 2017
Indicators value changes by year
Minimum:
-37.933
jan 1, 1994
At the date of observation
Value
Absolute change
Change from previous value
jan 1, 1978
1.942
+1.942
0.0%
jan 1, 1979
-15.238
-17.18
-884.68%
jan 1, 1980
8.989
+24.227
-158.99%
jan 1, 1981
13.402
+4.413
49.1%
jan 1, 1982
4.412
-8.991
-67.08%
jan 1, 1983
4.225
-0.186
-4.23%
jan 1, 1984
-7.432
-11.658
-275.9%
jan 1, 1985
-18.248
-10.816
145.52%
jan 1, 1986
9.821
+28.07
-153.82%
jan 1, 1987
4.878
-4.943
-50.33%
jan 1, 1988
0.775
-4.103
-84.11%
jan 1, 1989
6.138
+5.363
691.86%
jan 1, 1990
16.889
+10.75
175.13%
jan 1, 1991
13.776
-3.113
-18.43%
jan 1, 1992
5.221
-8.555
-62.1%
jan 1, 1993
2.815
-2.405
-46.07%
jan 1, 1994
-37.933
-40.749
-1.45K%
jan 1, 1995
24.445
+62.378
-164.44%
jan 1, 1996
24.384
-0.06
-0.25%
jan 1, 1997
2.669
-21.716
-89.06%
jan 1, 1998
2.853
+0.184
6.91%
jan 1, 1999
-9.135
-11.988
-420.16%
jan 1, 2000
0.0
+9.135
-100.0%
jan 1, 2001
26.23
+26.23
%
jan 1, 2002
8.375
-17.854
-68.07%
jan 1, 2003
6.918
-1.458
-17.4%
jan 1, 2004
-8.912
-15.83
-228.83%
jan 1, 2005
-0.884
+8.028
-90.08%
jan 1, 2006
6.952
+7.836
-885.99%
jan 1, 2007
10.512
+3.56
51.21%
jan 1, 2008
2.134
-8.378
-79.7%
jan 1, 2009
8.085
+5.952
278.91%
jan 1, 2010
-10.959
-19.045
-235.54%
jan 1, 2011
4.512
+15.471
-141.17%
jan 1, 2012
7.4
+2.888
64.01%
jan 1, 2013
15.041
+7.641
103.26%
jan 1, 2014
1.029
-14.012
-93.16%
jan 1, 2015
-6.991
-8.02
-779.17%
jan 1, 2016
8.382
+15.372
-219.89%
Ranking of countries by current statistics by years


Comments: