29
/
en
AIzaSyAYiBZKx7MnpbEhh9jyipgxe19OcubqV5w
April 1, 2024
250057
St. Kitts and Nevis
KNA
true
2
1
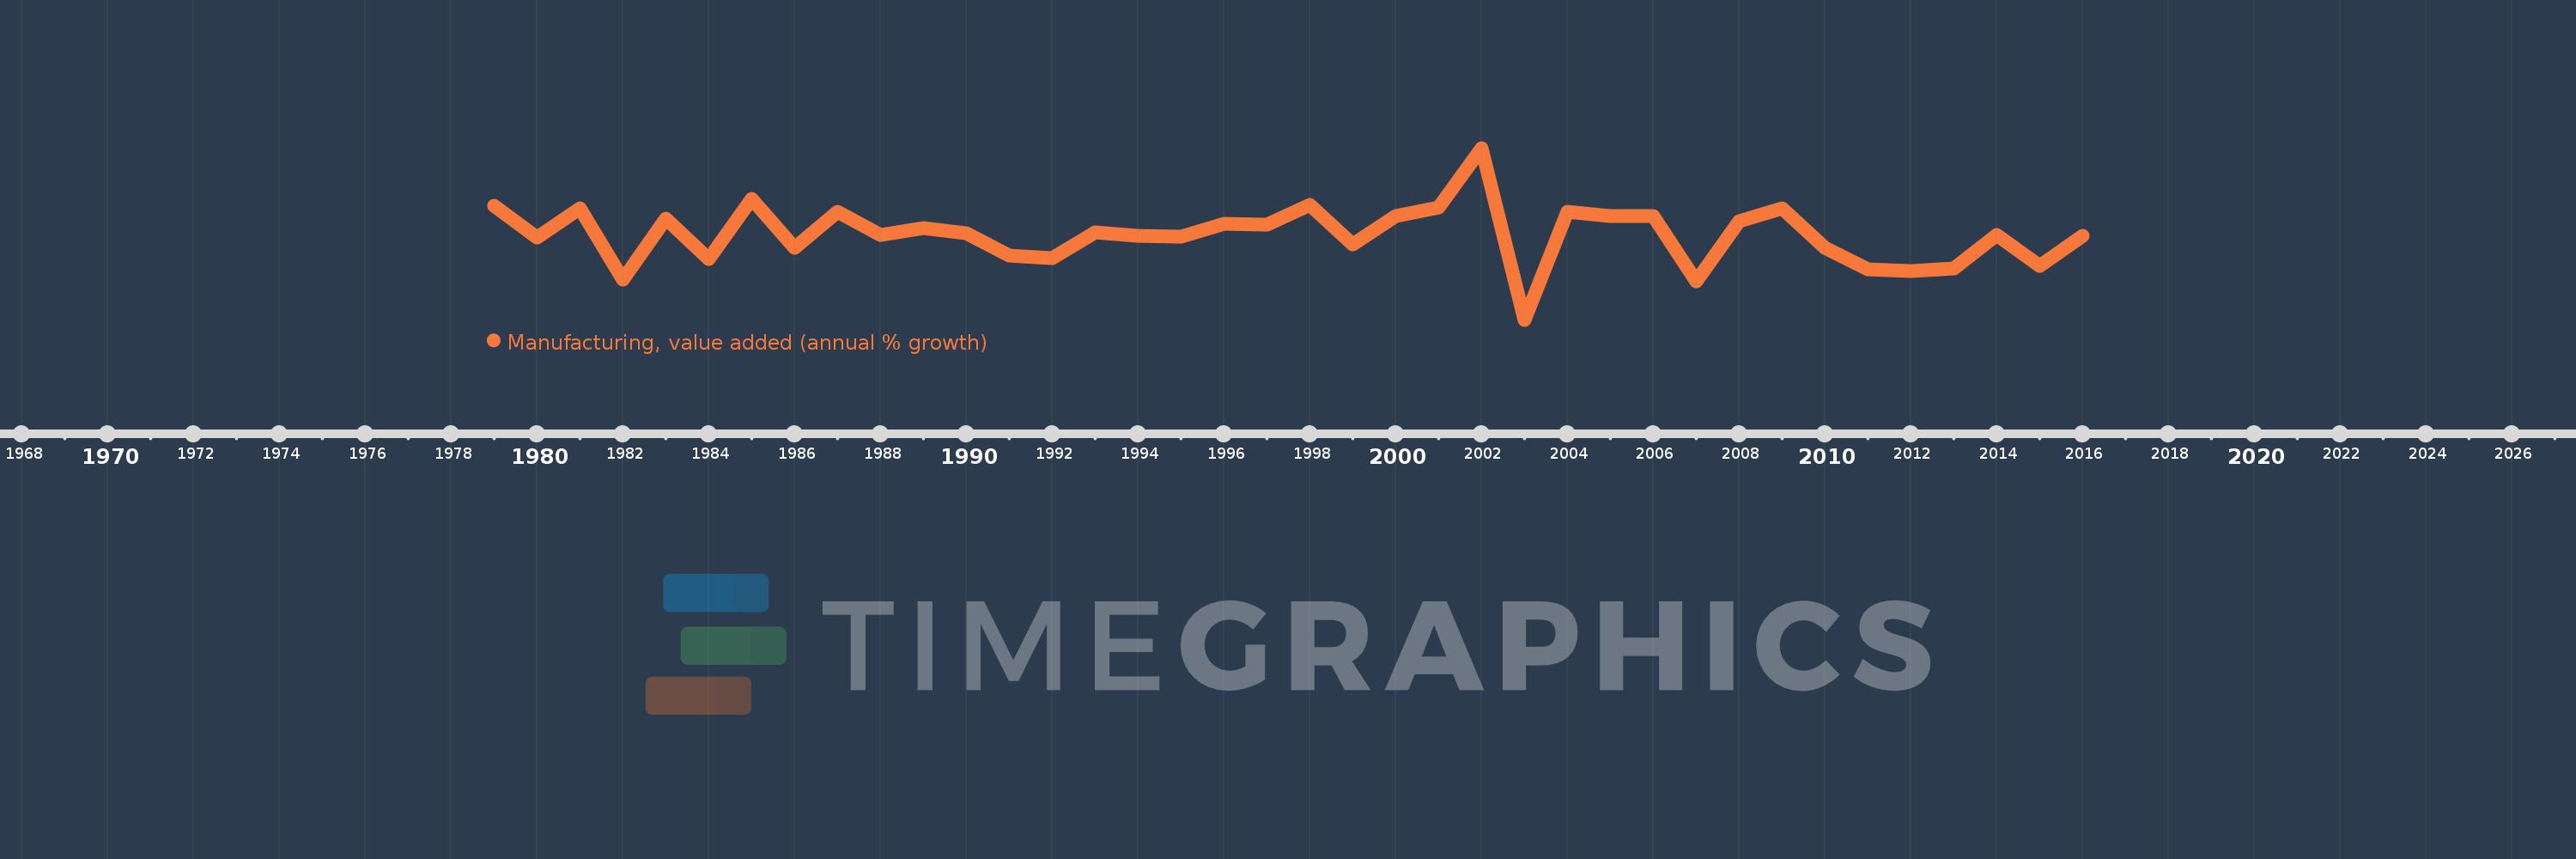
Manufacturing, value added (annual % growth)
2016,2015,2014,2013,2012,2011,2010,2009,2008,2007,2006,2005,2004,2003,2002,2001,2000,1999,1998,1997,1996,1995,1994,1993,1992,1991,1990,1989,1988,1987,1986,1985,1984,1983,1982,1981,1980,1979
This statistics in other country:
AfghanistanAlbaniaAlgeriaAntigua and BarbudaArab WorldArgentinaArmeniaAustraliaAustriaAzerbaijanBahamas, TheBahrainBangladeshBelarusBelgiumBelizeBeninBermudaBhutanBoliviaBosnia and HerzegovinaBotswanaBrazilBrunei DarussalamBurkina FasoBurundiCabo VerdeCambodiaCameroonCanadaCaribbean small statesCayman IslandsCentral African RepublicCentral Europe and the BalticsChadChileColombiaComorosCongo, Dem. Rep.Congo, Rep.Costa RicaCote d'IvoireCroatiaCubaCyprusCzech RepublicDenmarkDjiboutiDominicaDominican RepublicEarly-demographic dividendEcuadorEgypt, Arab Rep.El SalvadorEquatorial GuineaEritreaEstoniaEthiopiaEuro areaEurope & Central AsiaEurope & Central Asia (excluding high income)Europe & Central Asia (IDA & IBRD countries)European UnionFijiFinlandFragile and conflict affected situationsFranceGabonGambia, TheGeorgiaGermanyGhanaGreeceGrenadaGuatemalaGuineaGuyanaHaitiHeavily indebted poor countries (HIPC)High incomeHondurasHong Kong SAR, ChinaHungaryIcelandIDA blendIDA onlyIDA totalIndiaIndonesiaIran, Islamic Rep.IraqIrelandItalyJamaicaJapanJordanKazakhstanKenyaKiribatiKorea, Rep.KosovoKuwaitKyrgyz RepublicLao PDRLatin America & Caribbean Latin America & Caribbean (excluding high income)Latin America & the Caribbean (IDA & IBRD countries)LatviaLeast developed countries: UN classificationLebanonLesothoLiberiaLithuaniaLow incomeLower middle incomeLuxembourgMacedonia, FYRMadagascarMalawiMalaysiaMaldivesMarshall IslandsMauritaniaMauritiusMexicoMicronesia, Fed. Sts.Middle East & North AfricaMiddle East & North Africa (excluding high income)Middle East & North Africa (IDA & IBRD countries)MoldovaMongoliaMontenegroMoroccoMozambiqueMyanmarNamibiaNepalNetherlandsNew ZealandNicaraguaNigerNigeriaNorth AmericaNorwayOECD membersOmanOther small statesPacific island small statesPakistanPalauPanamaPapua New GuineaParaguayPeruPhilippinesPolandPortugalPost-demographic dividendPre-demographic dividendPuerto RicoQatarRomaniaRussian FederationRwandaSamoaSao Tome and PrincipeSaudi ArabiaSenegalSerbiaSeychellesSierra LeoneSingaporeSlovak RepublicSloveniaSmall statesSolomon IslandsSomaliaSouth AfricaSouth AsiaSouth Asia (IDA & IBRD)SpainSri LankaSt. Kitts and NevisSt. LuciaSt. Vincent and the GrenadinesSub-Saharan Africa Sub-Saharan Africa (excluding high income)Sub-Saharan Africa (IDA & IBRD countries)SudanSurinameSwazilandSwedenSwitzerlandSyrian Arab RepublicTajikistanTanzaniaThailandTimor-LesteTogoTongaTrinidad and TobagoTunisiaTurkeyTuvaluUgandaUkraineUnited Arab EmiratesUnited KingdomUnited StatesUruguayUzbekistanVanuatuVenezuela, RBVietnamWest Bank and GazaWorldZambiaZimbabwe Timeline:
This timeline shows a graph from 1979 to 2016 of St. Kitts and Nevis. No data until 1978. Number of actual observations by date: 38.
Source name:
World Development Indicators
Source organization:
World Bank national accounts data, and OECD National Accounts data files.
Categories, topics:
Economy & Growth
Last updated:
apr 23, 2017
Indicators value changes by year
Minimum:
-24.382
jan 1, 2003
At the date of observation
Value
Absolute change
Change from previous value
jan 1, 1979
11.001
+11.001
0.0%
jan 1, 1980
1.026
-9.975
-90.67%
jan 1, 1981
10.265
+9.238
900.2%
jan 1, 1982
-11.927
-22.192
-216.2%
jan 1, 1983
6.992
+18.919
-158.62%
jan 1, 1984
-5.454
-12.446
-178.01%
jan 1, 1985
13.225
+18.679
-342.47%
jan 1, 1986
-1.995
-15.219
-115.08%
jan 1, 1987
9.048
+11.043
-553.62%
jan 1, 1988
1.822
-7.227
-79.87%
jan 1, 1989
4.108
+2.286
125.5%
jan 1, 1990
2.567
-1.541
-37.51%
jan 1, 1991
-4.364
-6.931
-270.01%
jan 1, 1992
-5.169
-0.805
18.44%
jan 1, 1993
2.759
+7.928
-153.39%
jan 1, 1994
1.753
-1.006
-36.47%
jan 1, 1995
1.374
-0.379
-21.62%
jan 1, 1996
5.336
+3.961
288.28%
jan 1, 1997
5.249
-0.086
-1.62%
jan 1, 1998
11.236
+5.987
114.06%
jan 1, 1999
-0.89
-12.126
-107.92%
jan 1, 2000
7.904
+8.793
-988.29%
jan 1, 2001
10.382
+2.478
31.36%
jan 1, 2002
28.98
+18.598
179.14%
jan 1, 2003
-24.382
-53.362
-184.13%
jan 1, 2004
9.046
+33.428
-137.1%
jan 1, 2005
7.859
-1.187
-13.12%
jan 1, 2006
7.892
+0.033
0.42%
jan 1, 2007
-12.437
-20.33
-257.59%
jan 1, 2008
6.118
+18.555
-149.19%
jan 1, 2009
10.242
+4.124
67.41%
jan 1, 2010
-2.092
-12.334
-120.43%
jan 1, 2011
-8.588
-6.495
310.41%
jan 1, 2012
-9.149
-0.561
6.54%
jan 1, 2013
-8.429
+0.72
-7.87%
jan 1, 2014
1.951
+10.38
-123.14%
jan 1, 2015
-7.61
-9.561
-490.11%
jan 1, 2016
1.733
+9.344
-122.78%
Ranking of countries by current statistics by years


Comments: