29
/
en
AIzaSyAYiBZKx7MnpbEhh9jyipgxe19OcubqV5w
April 1, 2024
122399
Dominican Republic
DOM
true
2
1
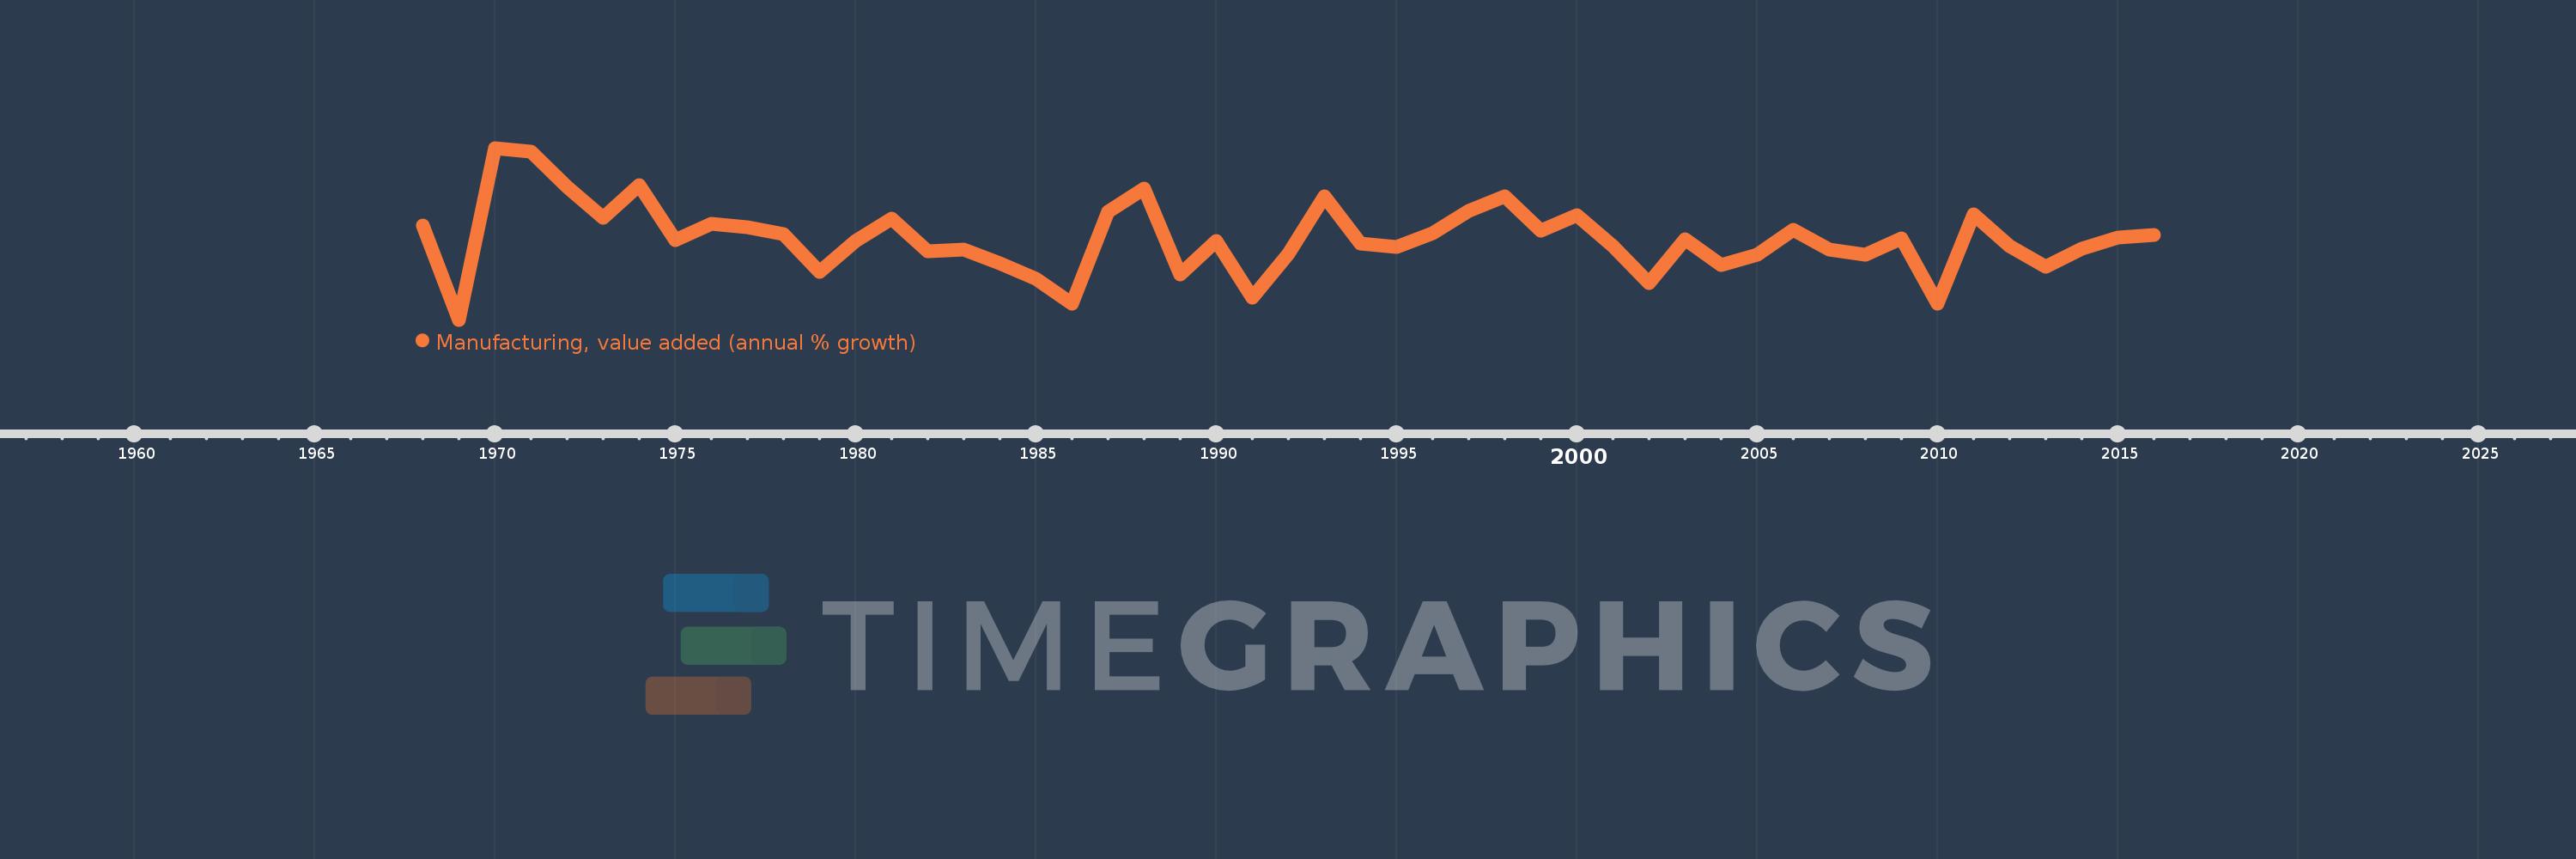
Manufacturing, value added (annual % growth)
2016,2015,2014,2013,2012,2011,2010,2009,2008,2007,2006,2005,2004,2003,2002,2001,2000,1999,1998,1997,1996,1995,1994,1993,1992,1991,1990,1989,1988,1987,1986,1985,1984,1983,1982,1981,1980,1979,1978,1977,1976,1975,1974,1973,1972,1971,1970,1969,1968
This statistics in other country:
AfghanistanAlbaniaAlgeriaAntigua and BarbudaArab WorldArgentinaArmeniaAustraliaAustriaAzerbaijanBahamas, TheBahrainBangladeshBelarusBelgiumBelizeBeninBermudaBhutanBoliviaBosnia and HerzegovinaBotswanaBrazilBrunei DarussalamBurkina FasoBurundiCabo VerdeCambodiaCameroonCanadaCaribbean small statesCayman IslandsCentral African RepublicCentral Europe and the BalticsChadChileColombiaComorosCongo, Dem. Rep.Congo, Rep.Costa RicaCote d'IvoireCroatiaCubaCyprusCzech RepublicDenmarkDjiboutiDominicaDominican RepublicEarly-demographic dividendEcuadorEgypt, Arab Rep.El SalvadorEquatorial GuineaEritreaEstoniaEthiopiaEuro areaEurope & Central AsiaEurope & Central Asia (excluding high income)Europe & Central Asia (IDA & IBRD countries)European UnionFijiFinlandFragile and conflict affected situationsFranceGabonGambia, TheGeorgiaGermanyGhanaGreeceGrenadaGuatemalaGuineaGuyanaHaitiHeavily indebted poor countries (HIPC)High incomeHondurasHong Kong SAR, ChinaHungaryIcelandIDA blendIDA onlyIDA totalIndiaIndonesiaIran, Islamic Rep.IraqIrelandItalyJamaicaJapanJordanKazakhstanKenyaKiribatiKorea, Rep.KosovoKuwaitKyrgyz RepublicLao PDRLatin America & Caribbean Latin America & Caribbean (excluding high income)Latin America & the Caribbean (IDA & IBRD countries)LatviaLeast developed countries: UN classificationLebanonLesothoLiberiaLithuaniaLow incomeLower middle incomeLuxembourgMacedonia, FYRMadagascarMalawiMalaysiaMaldivesMarshall IslandsMauritaniaMauritiusMexicoMicronesia, Fed. Sts.Middle East & North AfricaMiddle East & North Africa (excluding high income)Middle East & North Africa (IDA & IBRD countries)MoldovaMongoliaMontenegroMoroccoMozambiqueMyanmarNamibiaNepalNetherlandsNew ZealandNicaraguaNigerNigeriaNorth AmericaNorwayOECD membersOmanOther small statesPacific island small statesPakistanPalauPanamaPapua New GuineaParaguayPeruPhilippinesPolandPortugalPost-demographic dividendPre-demographic dividendPuerto RicoQatarRomaniaRussian FederationRwandaSamoaSao Tome and PrincipeSaudi ArabiaSenegalSerbiaSeychellesSierra LeoneSingaporeSlovak RepublicSloveniaSmall statesSolomon IslandsSomaliaSouth AfricaSouth AsiaSouth Asia (IDA & IBRD)SpainSri LankaSt. Kitts and NevisSt. LuciaSt. Vincent and the GrenadinesSub-Saharan Africa Sub-Saharan Africa (excluding high income)Sub-Saharan Africa (IDA & IBRD countries)SudanSurinameSwazilandSwedenSwitzerlandSyrian Arab RepublicTajikistanTanzaniaThailandTimor-LesteTogoTongaTrinidad and TobagoTunisiaTurkeyTuvaluUgandaUkraineUnited Arab EmiratesUnited KingdomUnited StatesUruguayUzbekistanVanuatuVenezuela, RBVietnamWest Bank and GazaWorldZambiaZimbabwe Timeline:
This timeline shows a graph from 1968 to 2016 of Dominican Republic. No data until 1967. Number of actual observations by date: 49.
Source name:
World Development Indicators
Source organization:
World Bank national accounts data, and OECD National Accounts data files.
Categories, topics:
Economy & Growth
Last updated:
apr 23, 2017
Indicators value changes by year
Minimum:
-7.639
jan 1, 1969
Maximum:
19.029
jan 1, 1970
At the date of observation
Value
Absolute change
Change from previous value
jan 1, 1968
7.043
+7.043
0.0%
jan 1, 1969
-7.639
-14.683
-208.46%
jan 1, 1970
19.029
+26.668
-349.09%
jan 1, 1971
18.5
-0.529
-2.78%
jan 1, 1972
12.949
-5.551
-30.0%
jan 1, 1973
8.179
-4.77
-36.84%
jan 1, 1974
13.321
+5.142
62.86%
jan 1, 1975
4.752
-8.569
-64.33%
jan 1, 1976
7.286
+2.534
53.32%
jan 1, 1977
6.744
-0.541
-7.43%
jan 1, 1978
5.684
-1.06
-15.72%
jan 1, 1979
-0.165
-5.85
-102.91%
jan 1, 1980
4.6
+4.766
-2.88K%
jan 1, 1981
8.043
+3.443
74.84%
jan 1, 1982
2.934
-5.109
-63.52%
jan 1, 1983
3.242
+0.308
10.51%
jan 1, 1984
1.087
-2.155
-66.47%
jan 1, 1985
-1.314
-2.401
-220.91%
jan 1, 1986
-5.206
-3.892
296.11%
jan 1, 1987
9.141
+14.346
-275.59%
jan 1, 1988
12.738
+3.598
39.36%
jan 1, 1989
-0.652
-13.391
-105.12%
jan 1, 1990
4.642
+5.294
-811.46%
jan 1, 1991
-4.276
-8.918
-192.13%
jan 1, 1992
2.62
+6.896
-161.26%
jan 1, 1993
11.535
+8.915
340.3%
jan 1, 1994
4.244
-7.291
-63.21%
jan 1, 1995
3.634
-0.61
-14.36%
jan 1, 1996
5.727
+2.093
57.59%
jan 1, 1997
9.269
+3.541
61.83%
jan 1, 1998
11.555
+2.286
24.66%
jan 1, 1999
6.24
-5.315
-46.0%
jan 1, 2000
8.591
+2.351
37.68%
jan 1, 2001
3.727
-4.864
-56.62%
jan 1, 2002
-1.898
-5.625
-150.93%
jan 1, 2003
4.916
+6.814
-359.01%
jan 1, 2004
0.912
-4.004
-81.44%
jan 1, 2005
2.411
+1.499
164.26%
jan 1, 2006
6.34
+3.928
162.91%
jan 1, 2007
3.247
-3.093
-48.79%
jan 1, 2008
2.408
-0.838
-25.82%
jan 1, 2009
5.024
+2.616
108.6%
jan 1, 2010
-5.178
-10.202
-203.06%
jan 1, 2011
8.674
+13.852
-267.52%
jan 1, 2012
3.746
-4.928
-56.82%
jan 1, 2013
0.524
-3.221
-86.0%
jan 1, 2014
3.344
+2.819
537.78%
jan 1, 2015
5.129
+1.785
53.39%
jan 1, 2016
5.462
+0.333
6.49%
Ranking of countries by current statistics by years


Comments: