29
/
en
AIzaSyAYiBZKx7MnpbEhh9jyipgxe19OcubqV5w
April 1, 2024
50196
Middle East & North Africa (IDA & IBRD countries)
TMN
false
2
1
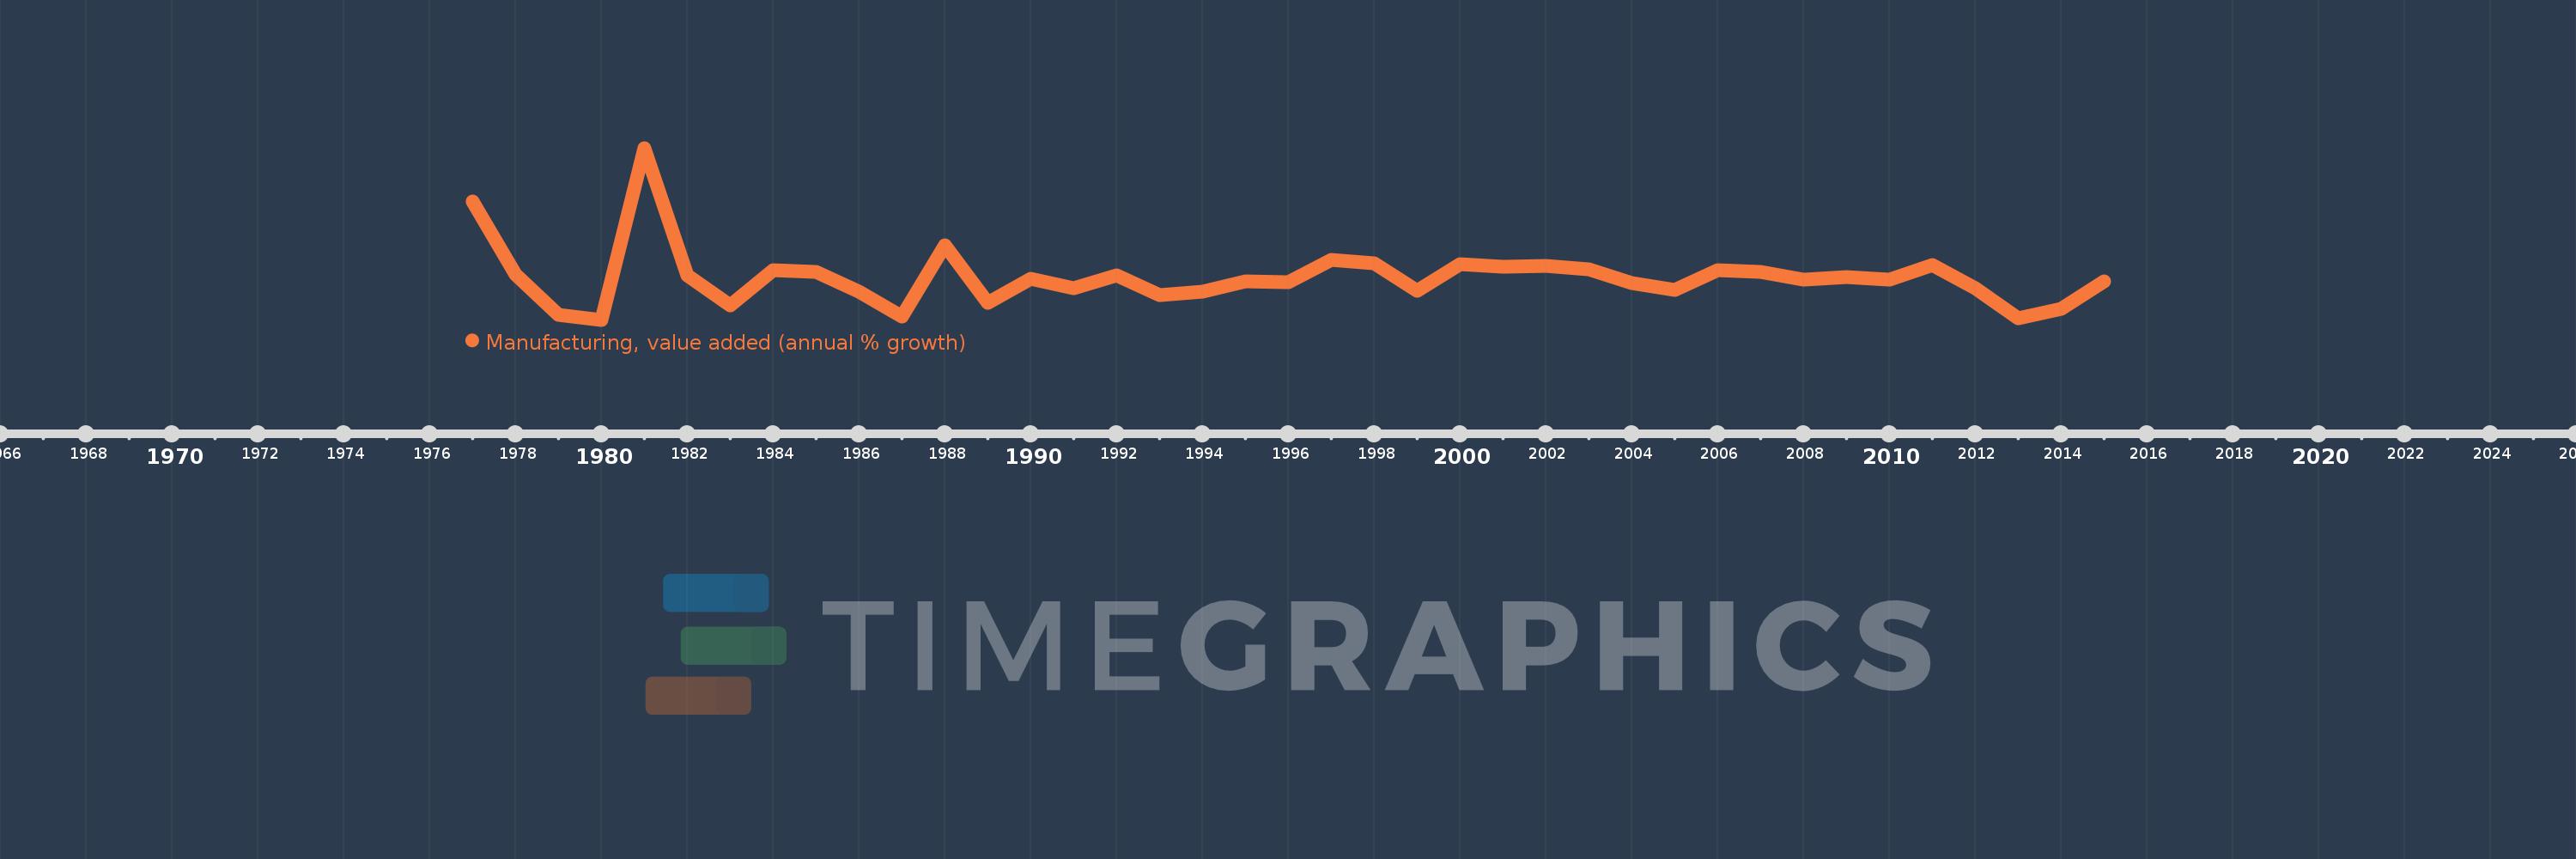
Manufacturing, value added (annual % growth)
2015,2014,2013,2012,2011,2010,2009,2008,2007,2006,2005,2004,2003,2002,2001,2000,1999,1998,1997,1996,1995,1994,1993,1992,1991,1990,1989,1988,1987,1986,1985,1984,1983,1982,1981,1980,1979,1978,1977
This statistics in other country:
AfghanistanAlbaniaAlgeriaAntigua and BarbudaArab WorldArgentinaArmeniaAustraliaAustriaAzerbaijanBahamas, TheBahrainBangladeshBelarusBelgiumBelizeBeninBermudaBhutanBoliviaBosnia and HerzegovinaBotswanaBrazilBrunei DarussalamBurkina FasoBurundiCabo VerdeCambodiaCameroonCanadaCaribbean small statesCayman IslandsCentral African RepublicCentral Europe and the BalticsChadChileColombiaComorosCongo, Dem. Rep.Congo, Rep.Costa RicaCote d'IvoireCroatiaCubaCyprusCzech RepublicDenmarkDjiboutiDominicaDominican RepublicEarly-demographic dividendEcuadorEgypt, Arab Rep.El SalvadorEquatorial GuineaEritreaEstoniaEthiopiaEuro areaEurope & Central AsiaEurope & Central Asia (excluding high income)Europe & Central Asia (IDA & IBRD countries)European UnionFijiFinlandFragile and conflict affected situationsFranceGabonGambia, TheGeorgiaGermanyGhanaGreeceGrenadaGuatemalaGuineaGuyanaHaitiHeavily indebted poor countries (HIPC)High incomeHondurasHong Kong SAR, ChinaHungaryIcelandIDA blendIDA onlyIDA totalIndiaIndonesiaIran, Islamic Rep.IraqIrelandItalyJamaicaJapanJordanKazakhstanKenyaKiribatiKorea, Rep.KosovoKuwaitKyrgyz RepublicLao PDRLatin America & Caribbean Latin America & Caribbean (excluding high income)Latin America & the Caribbean (IDA & IBRD countries)LatviaLeast developed countries: UN classificationLebanonLesothoLiberiaLithuaniaLow incomeLower middle incomeLuxembourgMacedonia, FYRMadagascarMalawiMalaysiaMaldivesMarshall IslandsMauritaniaMauritiusMexicoMicronesia, Fed. Sts.Middle East & North AfricaMiddle East & North Africa (excluding high income)Middle East & North Africa (IDA & IBRD countries)MoldovaMongoliaMontenegroMoroccoMozambiqueMyanmarNamibiaNepalNetherlandsNew ZealandNicaraguaNigerNigeriaNorth AmericaNorwayOECD membersOmanOther small statesPacific island small statesPakistanPalauPanamaPapua New GuineaParaguayPeruPhilippinesPolandPortugalPost-demographic dividendPre-demographic dividendPuerto RicoQatarRomaniaRussian FederationRwandaSamoaSao Tome and PrincipeSaudi ArabiaSenegalSerbiaSeychellesSierra LeoneSingaporeSlovak RepublicSloveniaSmall statesSolomon IslandsSomaliaSouth AfricaSouth AsiaSouth Asia (IDA & IBRD)SpainSri LankaSt. Kitts and NevisSt. LuciaSt. Vincent and the GrenadinesSub-Saharan Africa Sub-Saharan Africa (excluding high income)Sub-Saharan Africa (IDA & IBRD countries)SudanSurinameSwazilandSwedenSwitzerlandSyrian Arab RepublicTajikistanTanzaniaThailandTimor-LesteTogoTongaTrinidad and TobagoTunisiaTurkeyTuvaluUgandaUkraineUnited Arab EmiratesUnited KingdomUnited StatesUruguayUzbekistanVanuatuVenezuela, RBVietnamWest Bank and GazaWorldZambiaZimbabwe Timeline:
This timeline shows a graph from 1977 to 2015 of Middle East & North Africa (IDA & IBRD countries). No data until 1976. Number of actual observations by date: 39.
Source name:
World Development Indicators
Source organization:
World Bank national accounts data, and OECD National Accounts data files.
Categories, topics:
Economy & Growth
Last updated:
apr 23, 2017
Indicators value changes by year
Minimum:
-3.363
jan 1, 1980
Maximum:
31.766
jan 1, 1981
At the date of observation
Value
Absolute change
Change from previous value
jan 1, 1977
20.834
+20.834
0.0%
jan 1, 1978
5.936
-14.897
-71.51%
jan 1, 1979
-2.396
-8.332
-140.36%
jan 1, 1980
-3.363
-0.967
40.36%
jan 1, 1981
31.766
+35.128
-1.04K%
jan 1, 1982
5.706
-26.059
-82.04%
jan 1, 1983
-0.367
-6.073
-106.42%
jan 1, 1984
6.783
+7.149
-1.95K%
jan 1, 1985
6.41
-0.373
-5.5%
jan 1, 1986
2.315
-4.095
-63.88%
jan 1, 1987
-2.721
-5.036
-217.55%
jan 1, 1988
11.881
+14.602
-536.6%
jan 1, 1989
0.124
-11.757
-98.95%
jan 1, 1990
5.058
+4.934
3.97K%
jan 1, 1991
3.093
-1.966
-38.86%
jan 1, 1992
5.777
+2.684
86.78%
jan 1, 1993
1.76
-4.017
-69.53%
jan 1, 1994
2.371
+0.611
34.69%
jan 1, 1995
4.462
+2.091
88.21%
jan 1, 1996
4.273
-0.189
-4.23%
jan 1, 1997
8.814
+4.541
106.26%
jan 1, 1998
8.102
-0.712
-8.08%
jan 1, 1999
2.521
-5.581
-68.88%
jan 1, 2000
7.937
+5.415
214.81%
jan 1, 2001
7.475
-0.462
-5.82%
jan 1, 2002
7.626
+0.151
2.02%
jan 1, 2003
6.889
-0.736
-9.66%
jan 1, 2004
4.121
-2.769
-40.19%
jan 1, 2005
2.763
-1.358
-32.95%
jan 1, 2006
6.772
+4.009
145.1%
jan 1, 2007
6.427
-0.345
-5.1%
jan 1, 2008
4.926
-1.501
-23.35%
jan 1, 2009
5.338
+0.412
8.35%
jan 1, 2010
4.889
-0.449
-8.41%
jan 1, 2011
7.898
+3.01
61.56%
jan 1, 2012
3.143
-4.755
-60.2%
jan 1, 2013
-3.1
-6.244
-198.63%
jan 1, 2014
-1.11
+1.99
-64.19%
jan 1, 2015
4.566
+5.676
-511.27%
Ranking of countries by current statistics by years


Comments: