29
/
en
AIzaSyAYiBZKx7MnpbEhh9jyipgxe19OcubqV5w
April 1, 2024
244735
Somalia
SOM
true
2
1
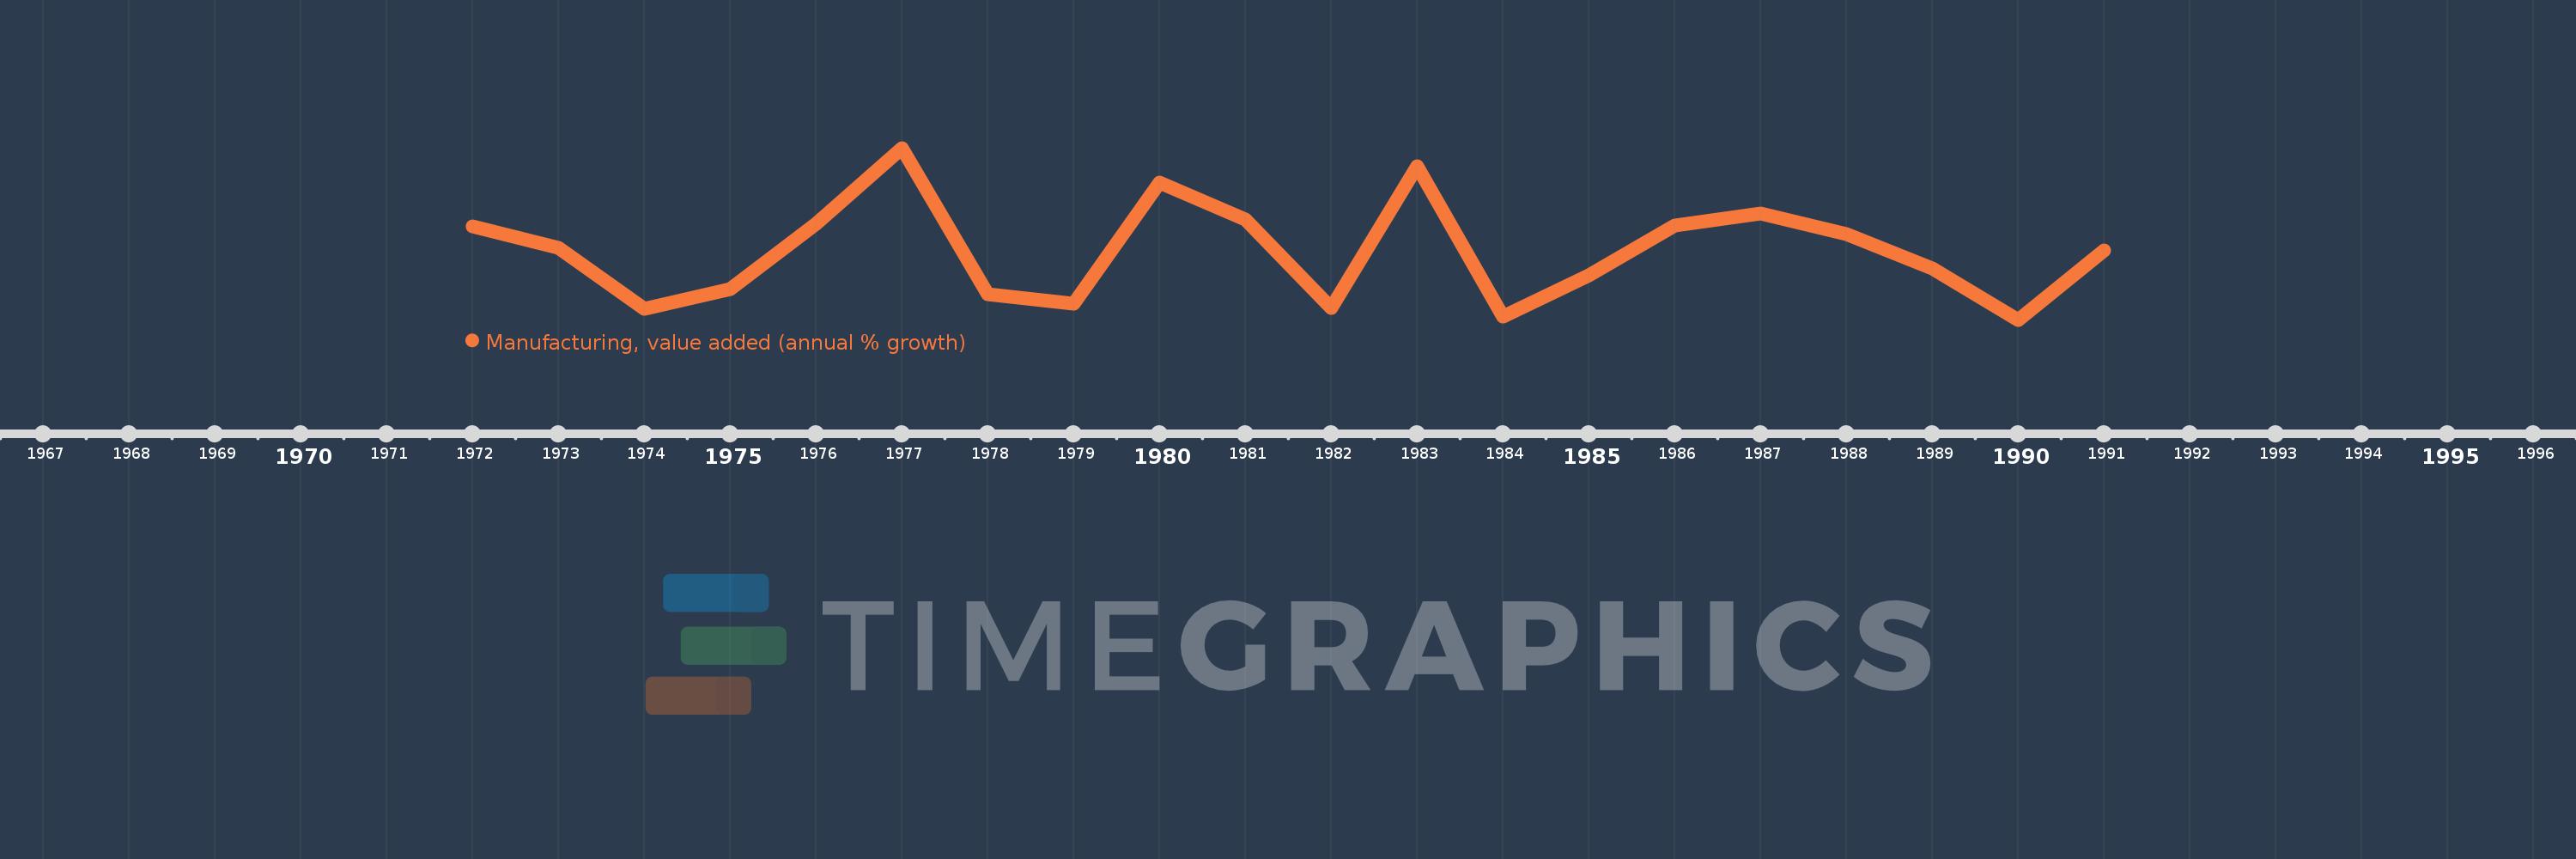
Manufacturing, value added (annual % growth)
1991,1990,1989,1988,1987,1986,1985,1984,1983,1982,1981,1980,1979,1978,1977,1976,1975,1974,1973,1972
This statistics in other country:
AfghanistanAlbaniaAlgeriaAntigua and BarbudaArab WorldArgentinaArmeniaAustraliaAustriaAzerbaijanBahamas, TheBahrainBangladeshBelarusBelgiumBelizeBeninBermudaBhutanBoliviaBosnia and HerzegovinaBotswanaBrazilBrunei DarussalamBurkina FasoBurundiCabo VerdeCambodiaCameroonCanadaCaribbean small statesCayman IslandsCentral African RepublicCentral Europe and the BalticsChadChileColombiaComorosCongo, Dem. Rep.Congo, Rep.Costa RicaCote d'IvoireCroatiaCubaCyprusCzech RepublicDenmarkDjiboutiDominicaDominican RepublicEarly-demographic dividendEcuadorEgypt, Arab Rep.El SalvadorEquatorial GuineaEritreaEstoniaEthiopiaEuro areaEurope & Central AsiaEurope & Central Asia (excluding high income)Europe & Central Asia (IDA & IBRD countries)European UnionFijiFinlandFragile and conflict affected situationsFranceGabonGambia, TheGeorgiaGermanyGhanaGreeceGrenadaGuatemalaGuineaGuyanaHaitiHeavily indebted poor countries (HIPC)High incomeHondurasHong Kong SAR, ChinaHungaryIcelandIDA blendIDA onlyIDA totalIndiaIndonesiaIran, Islamic Rep.IraqIrelandItalyJamaicaJapanJordanKazakhstanKenyaKiribatiKorea, Rep.KosovoKuwaitKyrgyz RepublicLao PDRLatin America & Caribbean Latin America & Caribbean (excluding high income)Latin America & the Caribbean (IDA & IBRD countries)LatviaLeast developed countries: UN classificationLebanonLesothoLiberiaLithuaniaLow incomeLower middle incomeLuxembourgMacedonia, FYRMadagascarMalawiMalaysiaMaldivesMarshall IslandsMauritaniaMauritiusMexicoMicronesia, Fed. Sts.Middle East & North AfricaMiddle East & North Africa (excluding high income)Middle East & North Africa (IDA & IBRD countries)MoldovaMongoliaMontenegroMoroccoMozambiqueMyanmarNamibiaNepalNetherlandsNew ZealandNicaraguaNigerNigeriaNorth AmericaNorwayOECD membersOmanOther small statesPacific island small statesPakistanPalauPanamaPapua New GuineaParaguayPeruPhilippinesPolandPortugalPost-demographic dividendPre-demographic dividendPuerto RicoQatarRomaniaRussian FederationRwandaSamoaSao Tome and PrincipeSaudi ArabiaSenegalSerbiaSeychellesSierra LeoneSingaporeSlovak RepublicSloveniaSmall statesSolomon IslandsSomaliaSouth AfricaSouth AsiaSouth Asia (IDA & IBRD)SpainSri LankaSt. Kitts and NevisSt. LuciaSt. Vincent and the GrenadinesSub-Saharan Africa Sub-Saharan Africa (excluding high income)Sub-Saharan Africa (IDA & IBRD countries)SudanSurinameSwazilandSwedenSwitzerlandSyrian Arab RepublicTajikistanTanzaniaThailandTimor-LesteTogoTongaTrinidad and TobagoTunisiaTurkeyTuvaluUgandaUkraineUnited Arab EmiratesUnited KingdomUnited StatesUruguayUzbekistanVanuatuVenezuela, RBVietnamWest Bank and GazaWorldZambiaZimbabwe Timeline:
This timeline shows a graph from 1972 to 1991 of Somalia. No data until 1971. Number of actual observations by date: 20.
Source name:
World Development Indicators
Source organization:
World Bank national accounts data, and OECD National Accounts data files.
Categories, topics:
Economy & Growth
Last updated:
apr 23, 2017
Indicators value changes by year
Minimum:
-20.013
jan 1, 1990
Maximum:
29.767
jan 1, 1977
At the date of observation
Value
Absolute change
Change from previous value
jan 1, 1972
6.96
+6.96
0.0%
jan 1, 1973
0.929
-6.03
-86.64%
jan 1, 1974
-16.745
-17.674
-1.9K%
jan 1, 1975
-11.198
+5.547
-33.13%
jan 1, 1976
7.665
+18.862
-168.45%
jan 1, 1977
29.767
+22.102
288.37%
jan 1, 1978
-12.726
-42.493
-142.75%
jan 1, 1979
-15.481
-2.755
21.65%
jan 1, 1980
19.794
+35.275
-227.86%
jan 1, 1981
9.099
-10.695
-54.03%
jan 1, 1982
-16.66
-25.759
-283.1%
jan 1, 1983
24.546
+41.206
-247.33%
jan 1, 1984
-18.988
-43.534
-177.36%
jan 1, 1985
-7.205
+11.784
-62.06%
jan 1, 1986
7.272
+14.477
-200.94%
jan 1, 1987
10.881
+3.608
49.62%
jan 1, 1988
4.896
-5.985
-55.01%
jan 1, 1989
-5.061
-9.957
-203.38%
jan 1, 1990
-20.013
-14.952
295.42%
jan 1, 1991
0.0
+20.013
-100.0%
Ranking of countries by current statistics by years


Comments: