29
/
en
AIzaSyAYiBZKx7MnpbEhh9jyipgxe19OcubqV5w
April 1, 2024
40081
IDA total
IDA
false
2
1
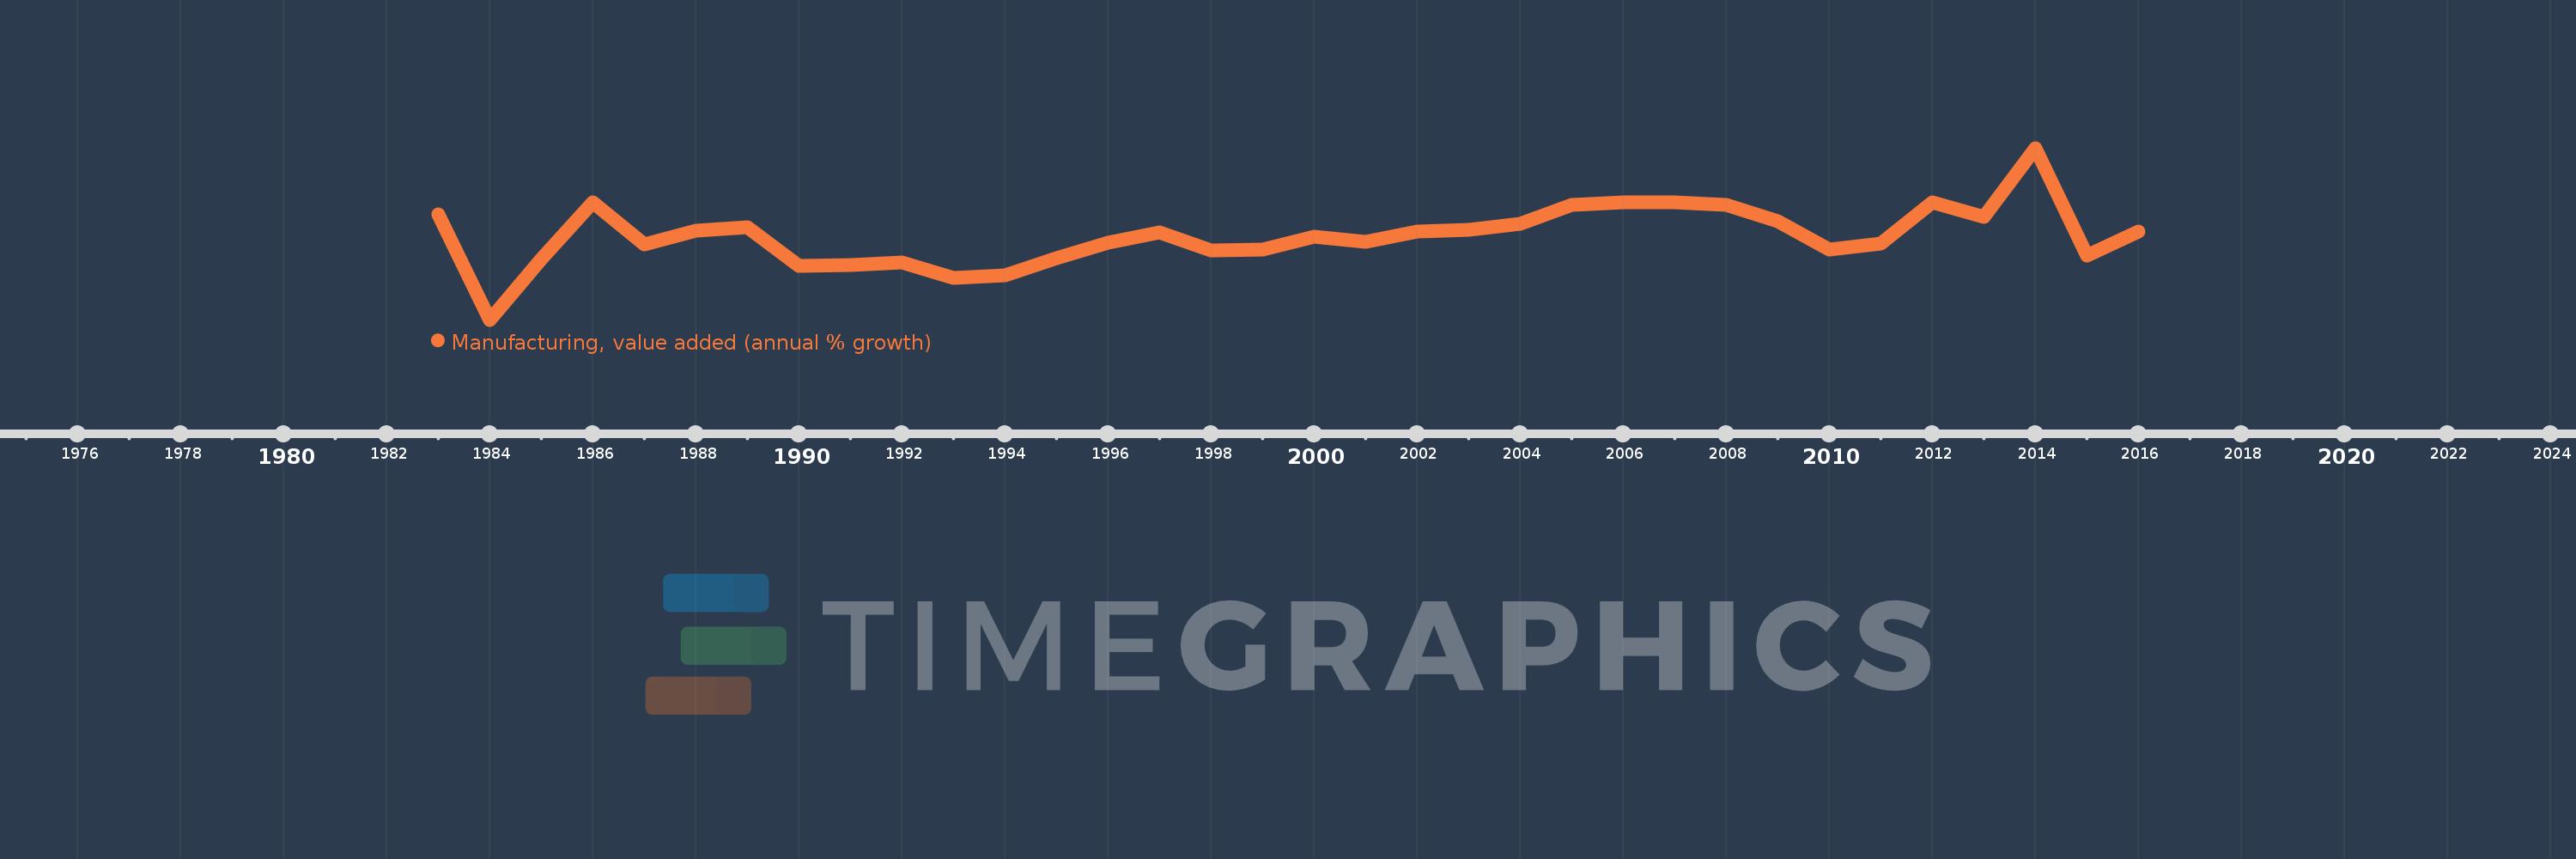
Manufacturing, value added (annual % growth)
2016,2015,2014,2013,2012,2011,2010,2009,2008,2007,2006,2005,2004,2003,2002,2001,2000,1999,1998,1997,1996,1995,1994,1993,1992,1991,1990,1989,1988,1987,1986,1985,1984,1983
This statistics in other country:
AfghanistanAlbaniaAlgeriaAntigua and BarbudaArab WorldArgentinaArmeniaAustraliaAustriaAzerbaijanBahamas, TheBahrainBangladeshBelarusBelgiumBelizeBeninBermudaBhutanBoliviaBosnia and HerzegovinaBotswanaBrazilBrunei DarussalamBurkina FasoBurundiCabo VerdeCambodiaCameroonCanadaCaribbean small statesCayman IslandsCentral African RepublicCentral Europe and the BalticsChadChileColombiaComorosCongo, Dem. Rep.Congo, Rep.Costa RicaCote d'IvoireCroatiaCubaCyprusCzech RepublicDenmarkDjiboutiDominicaDominican RepublicEarly-demographic dividendEcuadorEgypt, Arab Rep.El SalvadorEquatorial GuineaEritreaEstoniaEthiopiaEuro areaEurope & Central AsiaEurope & Central Asia (excluding high income)Europe & Central Asia (IDA & IBRD countries)European UnionFijiFinlandFragile and conflict affected situationsFranceGabonGambia, TheGeorgiaGermanyGhanaGreeceGrenadaGuatemalaGuineaGuyanaHaitiHeavily indebted poor countries (HIPC)High incomeHondurasHong Kong SAR, ChinaHungaryIcelandIDA blendIDA onlyIDA totalIndiaIndonesiaIran, Islamic Rep.IraqIrelandItalyJamaicaJapanJordanKazakhstanKenyaKiribatiKorea, Rep.KosovoKuwaitKyrgyz RepublicLao PDRLatin America & Caribbean Latin America & Caribbean (excluding high income)Latin America & the Caribbean (IDA & IBRD countries)LatviaLeast developed countries: UN classificationLebanonLesothoLiberiaLithuaniaLow incomeLower middle incomeLuxembourgMacedonia, FYRMadagascarMalawiMalaysiaMaldivesMarshall IslandsMauritaniaMauritiusMexicoMicronesia, Fed. Sts.Middle East & North AfricaMiddle East & North Africa (excluding high income)Middle East & North Africa (IDA & IBRD countries)MoldovaMongoliaMontenegroMoroccoMozambiqueMyanmarNamibiaNepalNetherlandsNew ZealandNicaraguaNigerNigeriaNorth AmericaNorwayOECD membersOmanOther small statesPacific island small statesPakistanPalauPanamaPapua New GuineaParaguayPeruPhilippinesPolandPortugalPost-demographic dividendPre-demographic dividendPuerto RicoQatarRomaniaRussian FederationRwandaSamoaSao Tome and PrincipeSaudi ArabiaSenegalSerbiaSeychellesSierra LeoneSingaporeSlovak RepublicSloveniaSmall statesSolomon IslandsSomaliaSouth AfricaSouth AsiaSouth Asia (IDA & IBRD)SpainSri LankaSt. Kitts and NevisSt. LuciaSt. Vincent and the GrenadinesSub-Saharan Africa Sub-Saharan Africa (excluding high income)Sub-Saharan Africa (IDA & IBRD countries)SudanSurinameSwazilandSwedenSwitzerlandSyrian Arab RepublicTajikistanTanzaniaThailandTimor-LesteTogoTongaTrinidad and TobagoTunisiaTurkeyTuvaluUgandaUkraineUnited Arab EmiratesUnited KingdomUnited StatesUruguayUzbekistanVanuatuVenezuela, RBVietnamWest Bank and GazaWorldZambiaZimbabwe Timeline:
This timeline shows a graph from 1983 to 2016 of IDA total. No data until 1982. Number of actual observations by date: 34.
Source name:
World Development Indicators
Source organization:
World Bank national accounts data, and OECD National Accounts data files.
Categories, topics:
Economy & Growth
Last updated:
apr 23, 2017
Indicators value changes by year
Minimum:
-6.153
jan 1, 1984
Maximum:
15.738
jan 1, 2014
At the date of observation
Value
Absolute change
Change from previous value
jan 1, 1983
7.227
+7.227
0.0%
jan 1, 1984
-6.153
-13.379
-185.14%
jan 1, 1985
1.636
+7.789
-126.6%
jan 1, 1986
8.843
+7.207
440.38%
jan 1, 1987
3.482
-5.361
-60.63%
jan 1, 1988
5.241
+1.76
50.54%
jan 1, 1989
5.669
+0.428
8.16%
jan 1, 1990
0.761
-4.908
-86.57%
jan 1, 1991
0.843
+0.082
10.75%
jan 1, 1992
1.098
+0.255
30.27%
jan 1, 1993
-0.822
-1.921
-174.86%
jan 1, 1994
-0.502
+0.32
-38.89%
jan 1, 1995
1.66
+2.162
-430.31%
jan 1, 1996
3.71
+2.051
123.55%
jan 1, 1997
4.961
+1.251
33.71%
jan 1, 1998
2.659
-2.303
-46.41%
jan 1, 1999
2.764
+0.106
3.97%
jan 1, 2000
4.461
+1.697
61.4%
jan 1, 2001
3.768
-0.694
-15.55%
jan 1, 2002
5.101
+1.333
35.39%
jan 1, 2003
5.338
+0.237
4.65%
jan 1, 2004
6.06
+0.722
13.53%
jan 1, 2005
8.477
+2.417
39.87%
jan 1, 2006
8.862
+0.385
4.54%
jan 1, 2007
8.767
-0.095
-1.07%
jan 1, 2008
8.451
-0.316
-3.6%
jan 1, 2009
6.353
-2.099
-24.83%
jan 1, 2010
2.742
-3.611
-56.84%
jan 1, 2011
3.525
+0.783
28.56%
jan 1, 2012
8.816
+5.291
150.09%
jan 1, 2013
6.978
-1.837
-20.84%
jan 1, 2014
15.738
+8.76
125.54%
jan 1, 2015
2.036
-13.702
-87.06%
jan 1, 2016
5.106
+3.07
150.75%
Ranking of countries by current statistics by years


Comments: