29
/
en
AIzaSyAYiBZKx7MnpbEhh9jyipgxe19OcubqV5w
April 1, 2024
205517
Namibia
NAM
true
2
1
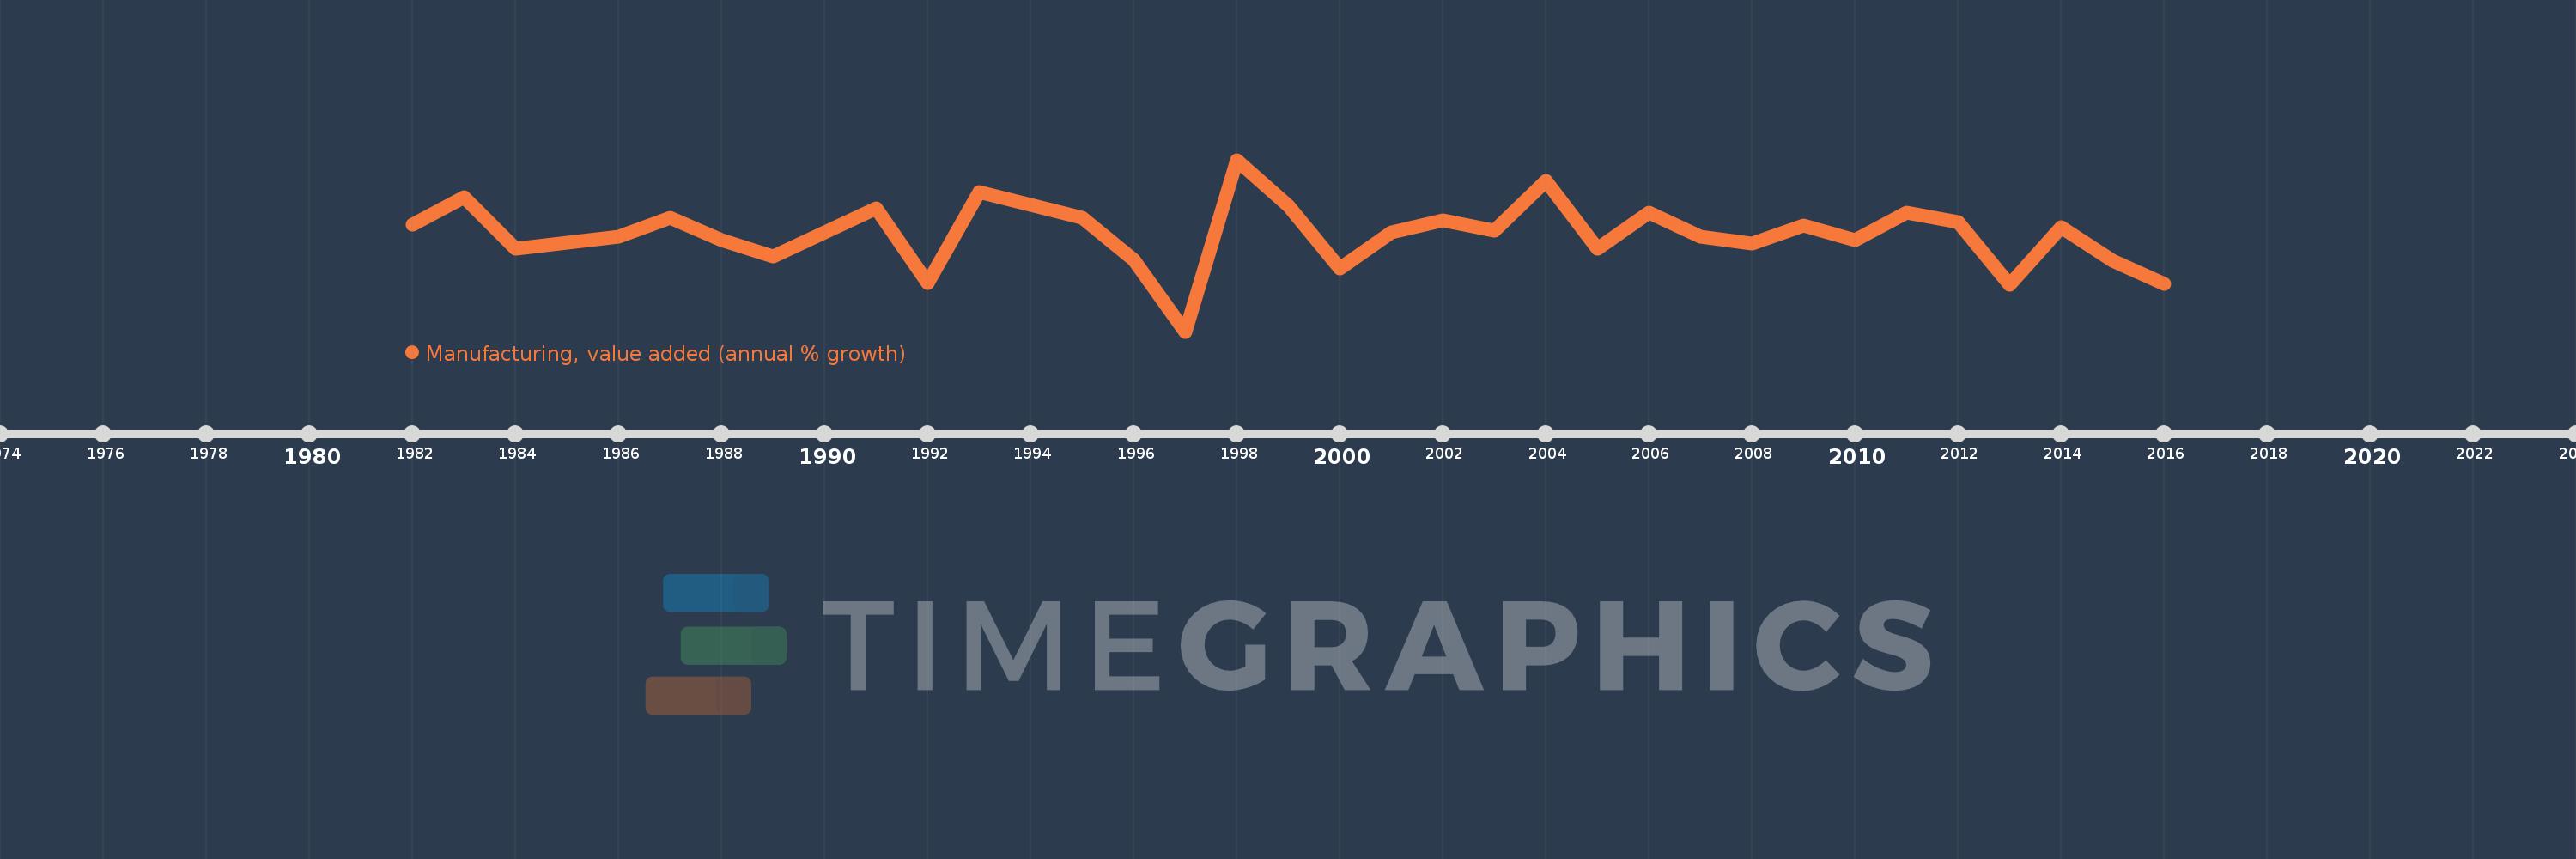
Manufacturing, value added (annual % growth)
2016,2015,2014,2013,2012,2011,2010,2009,2008,2007,2006,2005,2004,2003,2002,2001,2000,1999,1998,1997,1996,1995,1994,1993,1992,1991,1990,1989,1988,1987,1986,1985,1984,1983,1982
This statistics in other country:
AfghanistanAlbaniaAlgeriaAntigua and BarbudaArab WorldArgentinaArmeniaAustraliaAustriaAzerbaijanBahamas, TheBahrainBangladeshBelarusBelgiumBelizeBeninBermudaBhutanBoliviaBosnia and HerzegovinaBotswanaBrazilBrunei DarussalamBurkina FasoBurundiCabo VerdeCambodiaCameroonCanadaCaribbean small statesCayman IslandsCentral African RepublicCentral Europe and the BalticsChadChileColombiaComorosCongo, Dem. Rep.Congo, Rep.Costa RicaCote d'IvoireCroatiaCubaCyprusCzech RepublicDenmarkDjiboutiDominicaDominican RepublicEarly-demographic dividendEcuadorEgypt, Arab Rep.El SalvadorEquatorial GuineaEritreaEstoniaEthiopiaEuro areaEurope & Central AsiaEurope & Central Asia (excluding high income)Europe & Central Asia (IDA & IBRD countries)European UnionFijiFinlandFragile and conflict affected situationsFranceGabonGambia, TheGeorgiaGermanyGhanaGreeceGrenadaGuatemalaGuineaGuyanaHaitiHeavily indebted poor countries (HIPC)High incomeHondurasHong Kong SAR, ChinaHungaryIcelandIDA blendIDA onlyIDA totalIndiaIndonesiaIran, Islamic Rep.IraqIrelandItalyJamaicaJapanJordanKazakhstanKenyaKiribatiKorea, Rep.KosovoKuwaitKyrgyz RepublicLao PDRLatin America & Caribbean Latin America & Caribbean (excluding high income)Latin America & the Caribbean (IDA & IBRD countries)LatviaLeast developed countries: UN classificationLebanonLesothoLiberiaLithuaniaLow incomeLower middle incomeLuxembourgMacedonia, FYRMadagascarMalawiMalaysiaMaldivesMarshall IslandsMauritaniaMauritiusMexicoMicronesia, Fed. Sts.Middle East & North AfricaMiddle East & North Africa (excluding high income)Middle East & North Africa (IDA & IBRD countries)MoldovaMongoliaMontenegroMoroccoMozambiqueMyanmarNamibiaNepalNetherlandsNew ZealandNicaraguaNigerNigeriaNorth AmericaNorwayOECD membersOmanOther small statesPacific island small statesPakistanPalauPanamaPapua New GuineaParaguayPeruPhilippinesPolandPortugalPost-demographic dividendPre-demographic dividendPuerto RicoQatarRomaniaRussian FederationRwandaSamoaSao Tome and PrincipeSaudi ArabiaSenegalSerbiaSeychellesSierra LeoneSingaporeSlovak RepublicSloveniaSmall statesSolomon IslandsSomaliaSouth AfricaSouth AsiaSouth Asia (IDA & IBRD)SpainSri LankaSt. Kitts and NevisSt. LuciaSt. Vincent and the GrenadinesSub-Saharan Africa Sub-Saharan Africa (excluding high income)Sub-Saharan Africa (IDA & IBRD countries)SudanSurinameSwazilandSwedenSwitzerlandSyrian Arab RepublicTajikistanTanzaniaThailandTimor-LesteTogoTongaTrinidad and TobagoTunisiaTurkeyTuvaluUgandaUkraineUnited Arab EmiratesUnited KingdomUnited StatesUruguayUzbekistanVanuatuVenezuela, RBVietnamWest Bank and GazaWorldZambiaZimbabwe Timeline:
This timeline shows a graph from 1982 to 2016 of Namibia. No data until 1981. Number of actual observations by date: 35.
Source name:
World Development Indicators
Source organization:
World Bank national accounts data, and OECD National Accounts data files.
Categories, topics:
Economy & Growth
Last updated:
apr 23, 2017
Indicators value changes by year
Minimum:
-16.167
jan 1, 1997
Maximum:
17.983
jan 1, 1998
At the date of observation
Value
Absolute change
Change from previous value
jan 1, 1982
5.021
+5.021
0.0%
jan 1, 1983
10.512
+5.491
109.35%
jan 1, 1984
0.34
-10.172
-96.77%
jan 1, 1985
1.547
+1.207
355.02%
jan 1, 1986
2.635
+1.088
70.38%
jan 1, 1987
6.436
+3.801
144.24%
jan 1, 1988
2.024
-4.412
-68.55%
jan 1, 1989
-1.297
-3.321
-164.07%
jan 1, 1990
3.535
+4.832
-372.63%
jan 1, 1991
8.356
+4.821
136.36%
jan 1, 1992
-6.44
-14.796
-177.07%
jan 1, 1993
11.545
+17.985
-279.29%
jan 1, 1994
9.055
-2.49
-21.57%
jan 1, 1995
6.407
-2.648
-29.24%
jan 1, 1996
-1.904
-8.311
-129.72%
jan 1, 1997
-16.167
-14.263
749.01%
jan 1, 1998
17.983
+34.149
-211.23%
jan 1, 1999
8.887
-9.096
-50.58%
jan 1, 2000
-3.702
-12.589
-141.66%
jan 1, 2001
3.598
+7.3
-197.19%
jan 1, 2002
5.936
+2.337
64.96%
jan 1, 2003
3.963
-1.972
-33.23%
jan 1, 2004
13.862
+9.899
249.75%
jan 1, 2005
0.357
-13.505
-97.42%
jan 1, 2006
7.546
+7.189
2.01K%
jan 1, 2007
2.705
-4.84
-64.15%
jan 1, 2008
1.37
-1.335
-49.35%
jan 1, 2009
4.928
+3.558
259.66%
jan 1, 2010
2.024
-2.904
-58.92%
jan 1, 2011
7.506
+5.482
270.82%
jan 1, 2012
5.683
-1.823
-24.28%
jan 1, 2013
-6.836
-12.52
-220.28%
jan 1, 2014
4.575
+11.411
-166.92%
jan 1, 2015
-2.138
-6.713
-146.73%
jan 1, 2016
-6.638
-4.5
210.5%
Ranking of countries by current statistics by years


Comments: