29
/
en
AIzaSyAYiBZKx7MnpbEhh9jyipgxe19OcubqV5w
April 1, 2024
38328
IDA blend
IDB
false
2
1
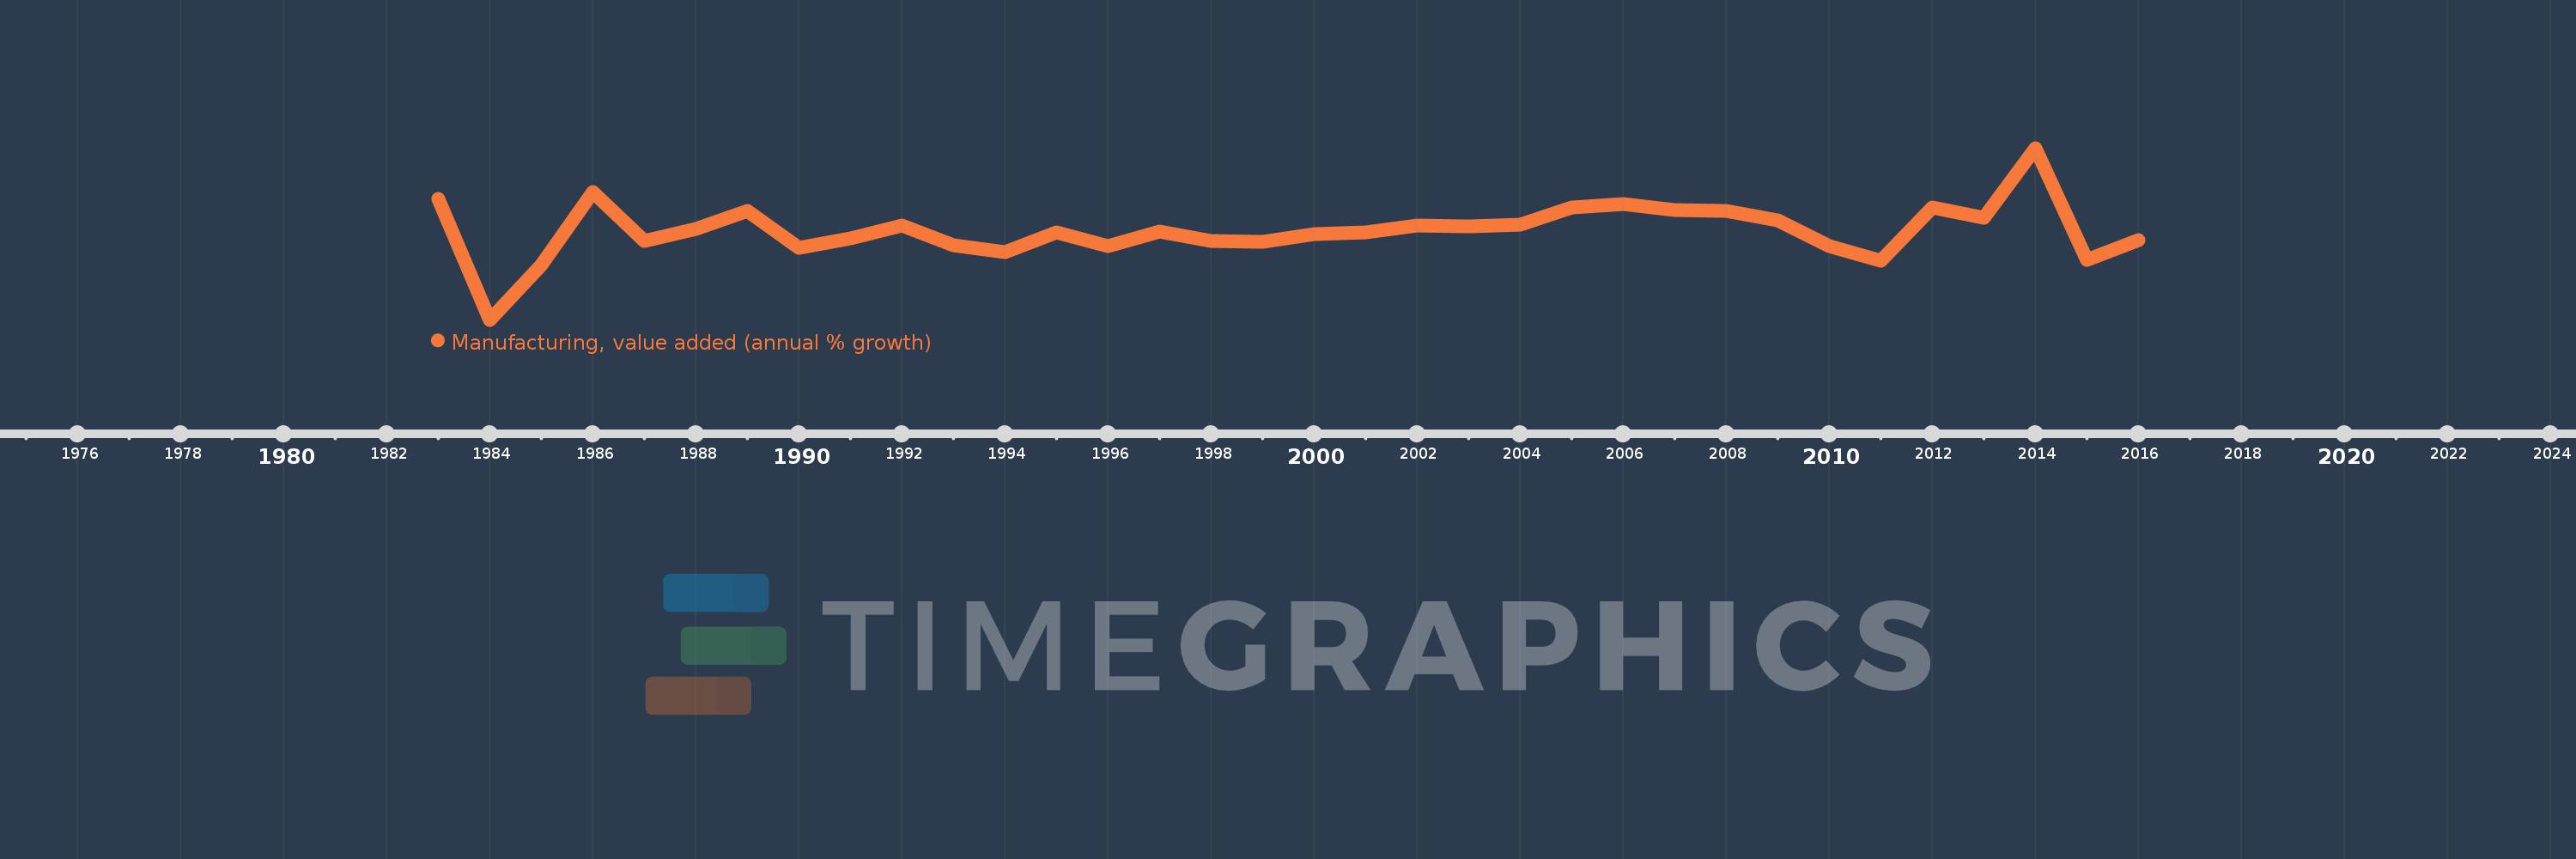
Manufacturing, value added (annual % growth)
2016,2015,2014,2013,2012,2011,2010,2009,2008,2007,2006,2005,2004,2003,2002,2001,2000,1999,1998,1997,1996,1995,1994,1993,1992,1991,1990,1989,1988,1987,1986,1985,1984,1983
This statistics in other country:
AfghanistanAlbaniaAlgeriaAntigua and BarbudaArab WorldArgentinaArmeniaAustraliaAustriaAzerbaijanBahamas, TheBahrainBangladeshBelarusBelgiumBelizeBeninBermudaBhutanBoliviaBosnia and HerzegovinaBotswanaBrazilBrunei DarussalamBurkina FasoBurundiCabo VerdeCambodiaCameroonCanadaCaribbean small statesCayman IslandsCentral African RepublicCentral Europe and the BalticsChadChileColombiaComorosCongo, Dem. Rep.Congo, Rep.Costa RicaCote d'IvoireCroatiaCubaCyprusCzech RepublicDenmarkDjiboutiDominicaDominican RepublicEarly-demographic dividendEcuadorEgypt, Arab Rep.El SalvadorEquatorial GuineaEritreaEstoniaEthiopiaEuro areaEurope & Central AsiaEurope & Central Asia (excluding high income)Europe & Central Asia (IDA & IBRD countries)European UnionFijiFinlandFragile and conflict affected situationsFranceGabonGambia, TheGeorgiaGermanyGhanaGreeceGrenadaGuatemalaGuineaGuyanaHaitiHeavily indebted poor countries (HIPC)High incomeHondurasHong Kong SAR, ChinaHungaryIcelandIDA blendIDA onlyIDA totalIndiaIndonesiaIran, Islamic Rep.IraqIrelandItalyJamaicaJapanJordanKazakhstanKenyaKiribatiKorea, Rep.KosovoKuwaitKyrgyz RepublicLao PDRLatin America & Caribbean Latin America & Caribbean (excluding high income)Latin America & the Caribbean (IDA & IBRD countries)LatviaLeast developed countries: UN classificationLebanonLesothoLiberiaLithuaniaLow incomeLower middle incomeLuxembourgMacedonia, FYRMadagascarMalawiMalaysiaMaldivesMarshall IslandsMauritaniaMauritiusMexicoMicronesia, Fed. Sts.Middle East & North AfricaMiddle East & North Africa (excluding high income)Middle East & North Africa (IDA & IBRD countries)MoldovaMongoliaMontenegroMoroccoMozambiqueMyanmarNamibiaNepalNetherlandsNew ZealandNicaraguaNigerNigeriaNorth AmericaNorwayOECD membersOmanOther small statesPacific island small statesPakistanPalauPanamaPapua New GuineaParaguayPeruPhilippinesPolandPortugalPost-demographic dividendPre-demographic dividendPuerto RicoQatarRomaniaRussian FederationRwandaSamoaSao Tome and PrincipeSaudi ArabiaSenegalSerbiaSeychellesSierra LeoneSingaporeSlovak RepublicSloveniaSmall statesSolomon IslandsSomaliaSouth AfricaSouth AsiaSouth Asia (IDA & IBRD)SpainSri LankaSt. Kitts and NevisSt. LuciaSt. Vincent and the GrenadinesSub-Saharan Africa Sub-Saharan Africa (excluding high income)Sub-Saharan Africa (IDA & IBRD countries)SudanSurinameSwazilandSwedenSwitzerlandSyrian Arab RepublicTajikistanTanzaniaThailandTimor-LesteTogoTongaTrinidad and TobagoTunisiaTurkeyTuvaluUgandaUkraineUnited Arab EmiratesUnited KingdomUnited StatesUruguayUzbekistanVanuatuVenezuela, RBVietnamWest Bank and GazaWorldZambiaZimbabwe Timeline:
This timeline shows a graph from 1983 to 2016 of IDA blend. No data until 1982. Number of actual observations by date: 34.
Source name:
World Development Indicators
Source organization:
World Bank national accounts data, and OECD National Accounts data files.
Categories, topics:
Economy & Growth
Last updated:
apr 23, 2017
Indicators value changes by year
Minimum:
-13.067
jan 1, 1984
Maximum:
21.541
jan 1, 2014
At the date of observation
Value
Absolute change
Change from previous value
jan 1, 1983
11.208
+11.208
0.0%
jan 1, 1984
-13.067
-24.275
-216.59%
jan 1, 1985
-1.961
+11.106
-84.99%
jan 1, 1986
12.642
+14.603
-744.61%
jan 1, 1987
2.76
-9.881
-78.17%
jan 1, 1988
5.143
+2.383
86.34%
jan 1, 1989
8.895
+3.752
72.95%
jan 1, 1990
1.36
-7.535
-84.71%
jan 1, 1991
3.374
+2.014
148.16%
jan 1, 1992
5.927
+2.553
75.68%
jan 1, 1993
1.995
-3.932
-66.34%
jan 1, 1994
0.496
-1.499
-75.13%
jan 1, 1995
4.499
+4.003
806.86%
jan 1, 1996
1.768
-2.731
-60.7%
jan 1, 1997
4.636
+2.868
162.25%
jan 1, 1998
2.758
-1.879
-40.52%
jan 1, 1999
2.587
-0.17
-6.18%
jan 1, 2000
4.125
+1.538
59.45%
jan 1, 2001
4.589
+0.464
11.24%
jan 1, 2002
6.0
+1.411
30.74%
jan 1, 2003
5.818
-0.182
-3.04%
jan 1, 2004
6.058
+0.24
4.13%
jan 1, 2005
9.571
+3.514
58.0%
jan 1, 2006
10.181
+0.61
6.37%
jan 1, 2007
9.066
-1.115
-10.95%
jan 1, 2008
8.904
-0.162
-1.79%
jan 1, 2009
6.968
-1.937
-21.75%
jan 1, 2010
1.808
-5.16
-74.05%
jan 1, 2011
-1.107
-2.915
-161.24%
jan 1, 2012
9.474
+10.581
-955.74%
jan 1, 2013
7.509
-1.964
-20.73%
jan 1, 2014
21.541
+14.031
186.85%
jan 1, 2015
-0.973
-22.514
-104.52%
jan 1, 2016
2.991
+3.964
-407.36%
Ranking of countries by current statistics by years


Comments: