29
/
en
AIzaSyAYiBZKx7MnpbEhh9jyipgxe19OcubqV5w
April 1, 2024
248989
Sri Lanka
LKA
true
2
1
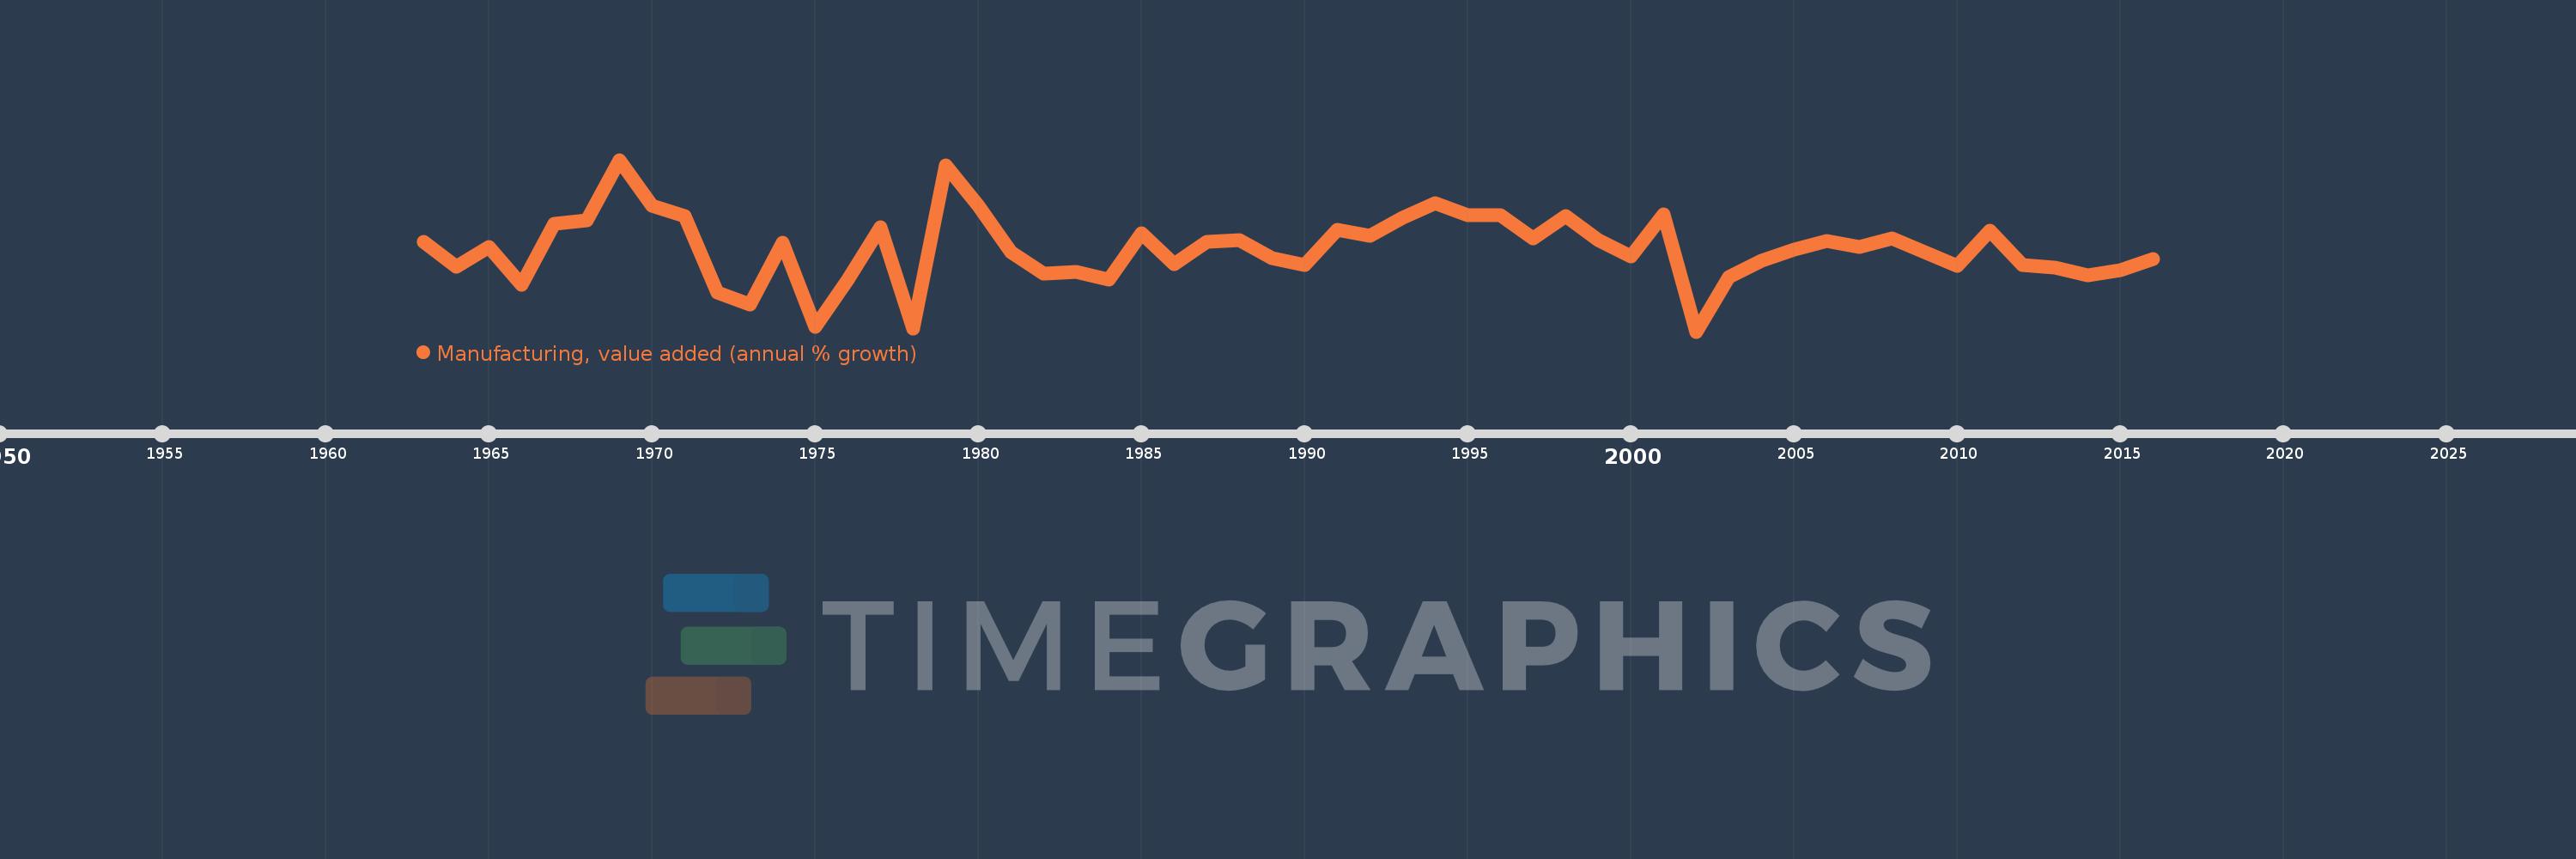
Manufacturing, value added (annual % growth)
2016,2015,2014,2013,2012,2011,2010,2009,2008,2007,2006,2005,2004,2003,2002,2001,2000,1999,1998,1997,1996,1995,1994,1993,1992,1991,1990,1989,1988,1987,1986,1985,1984,1983,1982,1981,1980,1979,1978,1977,1976,1975,1974,1973,1972,1971,1970,1969,1968,1967,1966,1965,1964,1963
This statistics in other country:
AfghanistanAlbaniaAlgeriaAntigua and BarbudaArab WorldArgentinaArmeniaAustraliaAustriaAzerbaijanBahamas, TheBahrainBangladeshBelarusBelgiumBelizeBeninBermudaBhutanBoliviaBosnia and HerzegovinaBotswanaBrazilBrunei DarussalamBurkina FasoBurundiCabo VerdeCambodiaCameroonCanadaCaribbean small statesCayman IslandsCentral African RepublicCentral Europe and the BalticsChadChileColombiaComorosCongo, Dem. Rep.Congo, Rep.Costa RicaCote d'IvoireCroatiaCubaCyprusCzech RepublicDenmarkDjiboutiDominicaDominican RepublicEarly-demographic dividendEcuadorEgypt, Arab Rep.El SalvadorEquatorial GuineaEritreaEstoniaEthiopiaEuro areaEurope & Central AsiaEurope & Central Asia (excluding high income)Europe & Central Asia (IDA & IBRD countries)European UnionFijiFinlandFragile and conflict affected situationsFranceGabonGambia, TheGeorgiaGermanyGhanaGreeceGrenadaGuatemalaGuineaGuyanaHaitiHeavily indebted poor countries (HIPC)High incomeHondurasHong Kong SAR, ChinaHungaryIcelandIDA blendIDA onlyIDA totalIndiaIndonesiaIran, Islamic Rep.IraqIrelandItalyJamaicaJapanJordanKazakhstanKenyaKiribatiKorea, Rep.KosovoKuwaitKyrgyz RepublicLao PDRLatin America & Caribbean Latin America & Caribbean (excluding high income)Latin America & the Caribbean (IDA & IBRD countries)LatviaLeast developed countries: UN classificationLebanonLesothoLiberiaLithuaniaLow incomeLower middle incomeLuxembourgMacedonia, FYRMadagascarMalawiMalaysiaMaldivesMarshall IslandsMauritaniaMauritiusMexicoMicronesia, Fed. Sts.Middle East & North AfricaMiddle East & North Africa (excluding high income)Middle East & North Africa (IDA & IBRD countries)MoldovaMongoliaMontenegroMoroccoMozambiqueMyanmarNamibiaNepalNetherlandsNew ZealandNicaraguaNigerNigeriaNorth AmericaNorwayOECD membersOmanOther small statesPacific island small statesPakistanPalauPanamaPapua New GuineaParaguayPeruPhilippinesPolandPortugalPost-demographic dividendPre-demographic dividendPuerto RicoQatarRomaniaRussian FederationRwandaSamoaSao Tome and PrincipeSaudi ArabiaSenegalSerbiaSeychellesSierra LeoneSingaporeSlovak RepublicSloveniaSmall statesSolomon IslandsSomaliaSouth AfricaSouth AsiaSouth Asia (IDA & IBRD)SpainSri LankaSt. Kitts and NevisSt. LuciaSt. Vincent and the GrenadinesSub-Saharan Africa Sub-Saharan Africa (excluding high income)Sub-Saharan Africa (IDA & IBRD countries)SudanSurinameSwazilandSwedenSwitzerlandSyrian Arab RepublicTajikistanTanzaniaThailandTimor-LesteTogoTongaTrinidad and TobagoTunisiaTurkeyTuvaluUgandaUkraineUnited Arab EmiratesUnited KingdomUnited StatesUruguayUzbekistanVanuatuVenezuela, RBVietnamWest Bank and GazaWorldZambiaZimbabwe Timeline:
This timeline shows a graph from 1963 to 2016 of Sri Lanka. No data until 1962. Number of actual observations by date: 54.
Source name:
World Development Indicators
Source organization:
World Bank national accounts data, and OECD National Accounts data files.
Categories, topics:
Economy & Growth
Last updated:
apr 23, 2017
Indicators value changes by year
Minimum:
-4.162
jan 1, 2002
Maximum:
15.461
jan 1, 1969
At the date of observation
Value
Absolute change
Change from previous value
jan 1, 1963
6.117
+6.117
0.0%
jan 1, 1964
3.28
-2.837
-46.38%
jan 1, 1965
5.475
+2.195
66.91%
jan 1, 1966
1.232
-4.243
-77.5%
jan 1, 1967
8.107
+6.875
558.17%
jan 1, 1968
8.51
+0.403
4.97%
jan 1, 1969
15.461
+6.951
81.68%
jan 1, 1970
10.238
-5.222
-33.78%
jan 1, 1971
9.036
-1.203
-11.75%
jan 1, 1972
0.307
-8.729
-96.6%
jan 1, 1973
-1.118
-1.425
-463.92%
jan 1, 1974
6.018
+7.135
-638.44%
jan 1, 1975
-3.618
-9.636
-160.12%
jan 1, 1976
1.805
+5.423
-149.89%
jan 1, 1977
7.743
+5.938
328.95%
jan 1, 1978
-3.851
-11.593
-149.73%
jan 1, 1979
14.87
+18.721
-486.16%
jan 1, 1980
10.173
-4.697
-31.59%
jan 1, 1981
4.927
-5.246
-51.57%
jan 1, 1982
2.458
-2.469
-50.12%
jan 1, 1983
2.645
+0.188
7.64%
jan 1, 1984
1.752
-0.894
-33.78%
jan 1, 1985
7.049
+5.297
302.35%
jan 1, 1986
3.524
-3.525
-50.01%
jan 1, 1987
6.087
+2.563
72.73%
jan 1, 1988
6.302
+0.215
3.53%
jan 1, 1989
4.203
-2.099
-33.31%
jan 1, 1990
3.421
-0.782
-18.61%
jan 1, 1991
7.513
+4.093
119.64%
jan 1, 1992
6.8
-0.713
-9.49%
jan 1, 1993
8.8
+2.0
29.41%
jan 1, 1994
10.5
+1.7
19.32%
jan 1, 1995
9.1
-1.4
-13.33%
jan 1, 1996
9.177
+0.077
0.84%
jan 1, 1997
6.523
-2.654
-28.92%
jan 1, 1998
9.053
+2.53
38.79%
jan 1, 1999
6.323
-2.73
-30.15%
jan 1, 2000
4.435
-1.889
-29.87%
jan 1, 2001
9.243
+4.809
108.44%
jan 1, 2002
-4.162
-13.405
-145.03%
jan 1, 2003
2.068
+6.23
-149.69%
jan 1, 2004
3.915
+1.848
89.35%
jan 1, 2005
5.173
+1.258
32.13%
jan 1, 2006
6.181
+1.008
19.48%
jan 1, 2007
5.549
-0.633
-10.24%
jan 1, 2008
6.447
+0.899
16.2%
jan 1, 2009
4.933
-1.514
-23.49%
jan 1, 2010
3.3
-1.633
-33.1%
jan 1, 2011
7.331
+4.03
122.11%
jan 1, 2012
3.468
-3.863
-52.69%
jan 1, 2013
3.159
-0.309
-8.9%
jan 1, 2014
2.26
-0.899
-28.46%
jan 1, 2015
2.889
+0.628
27.81%
jan 1, 2016
4.126
+1.237
42.83%
Ranking of countries by current statistics by years


Comments: