29
/
en
AIzaSyAYiBZKx7MnpbEhh9jyipgxe19OcubqV5w
April 1, 2024
123763
Ecuador
ECU
true
2
1
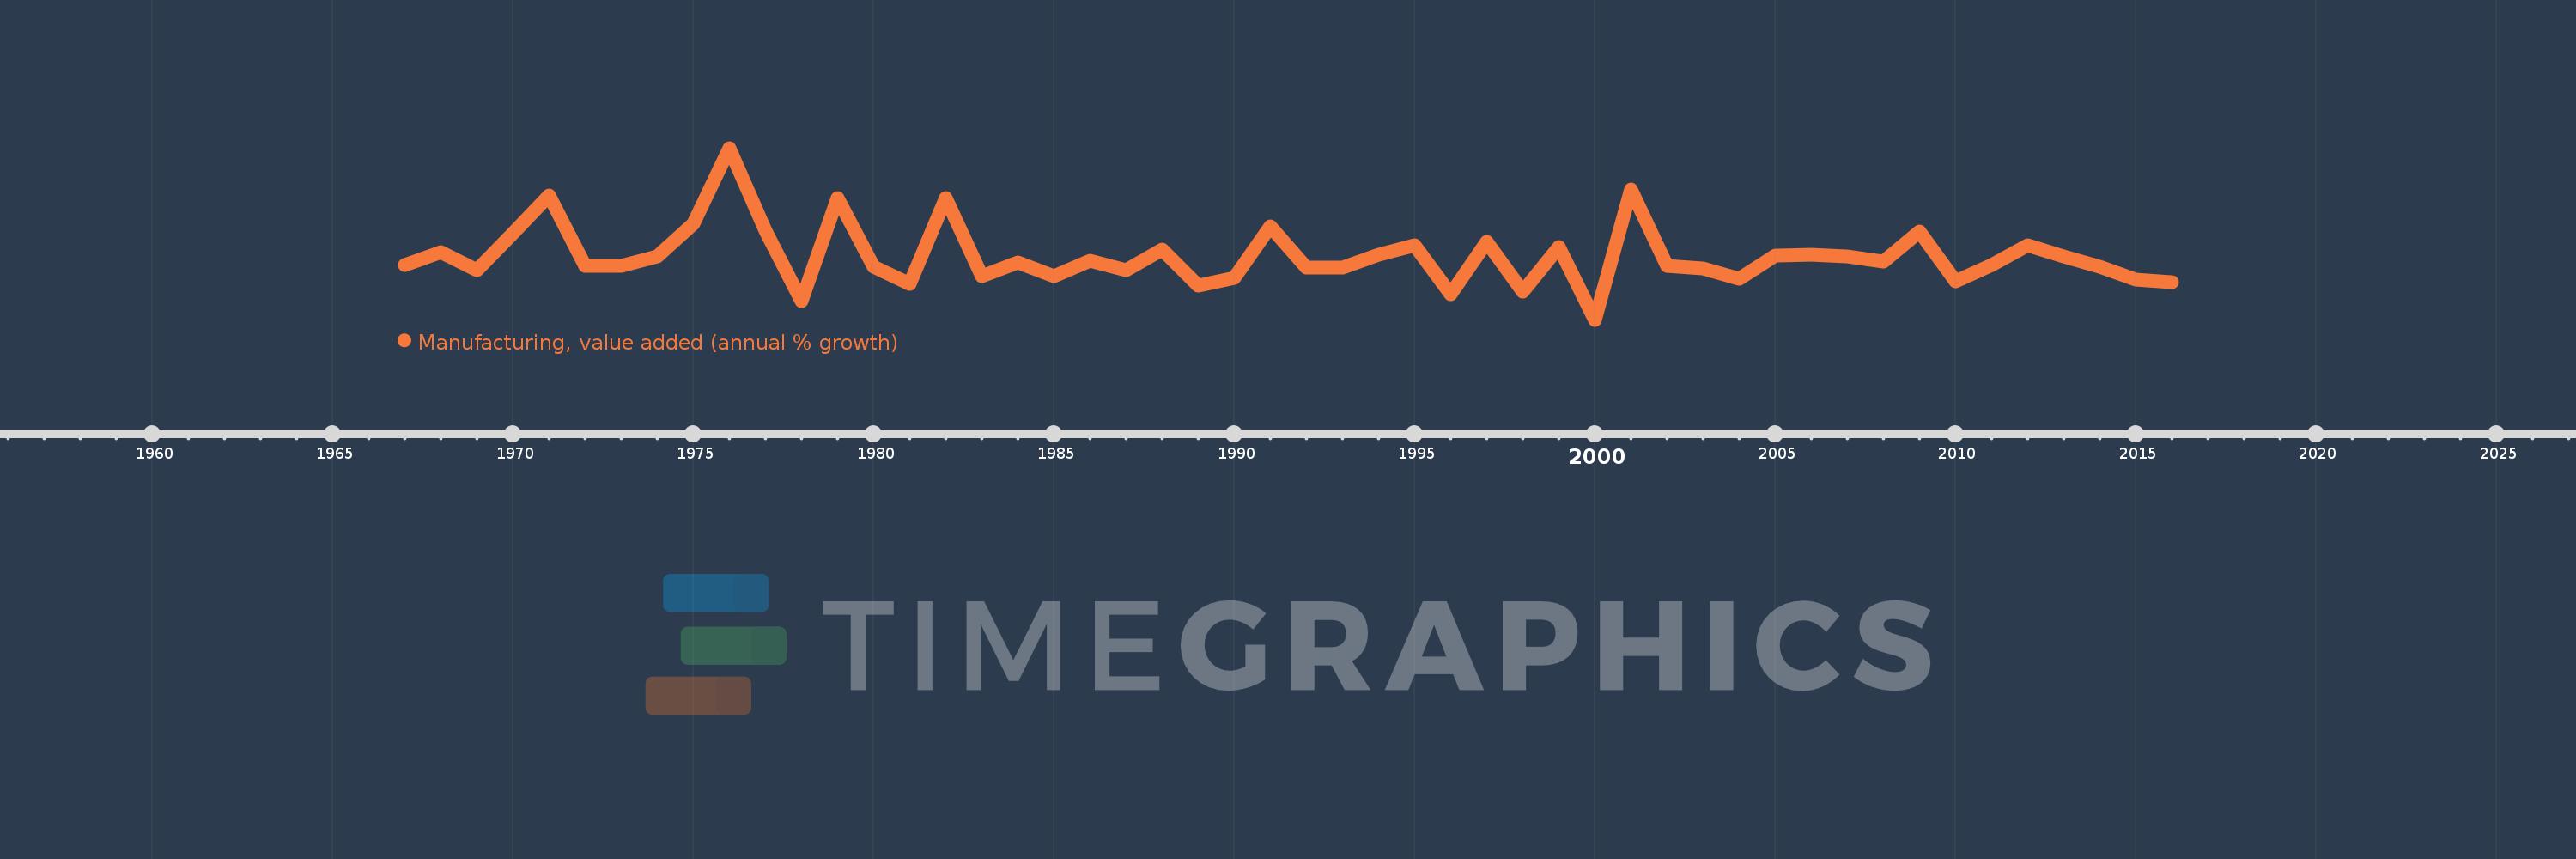
Manufacturing, value added (annual % growth)
2016,2015,2014,2013,2012,2011,2010,2009,2008,2007,2006,2005,2004,2003,2002,2001,2000,1999,1998,1997,1996,1995,1994,1993,1992,1991,1990,1989,1988,1987,1986,1985,1984,1983,1982,1981,1980,1979,1978,1977,1976,1975,1974,1973,1972,1971,1970,1969,1968,1967
This statistics in other country:
AfghanistanAlbaniaAlgeriaAntigua and BarbudaArab WorldArgentinaArmeniaAustraliaAustriaAzerbaijanBahamas, TheBahrainBangladeshBelarusBelgiumBelizeBeninBermudaBhutanBoliviaBosnia and HerzegovinaBotswanaBrazilBrunei DarussalamBurkina FasoBurundiCabo VerdeCambodiaCameroonCanadaCaribbean small statesCayman IslandsCentral African RepublicCentral Europe and the BalticsChadChileColombiaComorosCongo, Dem. Rep.Congo, Rep.Costa RicaCote d'IvoireCroatiaCubaCyprusCzech RepublicDenmarkDjiboutiDominicaDominican RepublicEarly-demographic dividendEcuadorEgypt, Arab Rep.El SalvadorEquatorial GuineaEritreaEstoniaEthiopiaEuro areaEurope & Central AsiaEurope & Central Asia (excluding high income)Europe & Central Asia (IDA & IBRD countries)European UnionFijiFinlandFragile and conflict affected situationsFranceGabonGambia, TheGeorgiaGermanyGhanaGreeceGrenadaGuatemalaGuineaGuyanaHaitiHeavily indebted poor countries (HIPC)High incomeHondurasHong Kong SAR, ChinaHungaryIcelandIDA blendIDA onlyIDA totalIndiaIndonesiaIran, Islamic Rep.IraqIrelandItalyJamaicaJapanJordanKazakhstanKenyaKiribatiKorea, Rep.KosovoKuwaitKyrgyz RepublicLao PDRLatin America & Caribbean Latin America & Caribbean (excluding high income)Latin America & the Caribbean (IDA & IBRD countries)LatviaLeast developed countries: UN classificationLebanonLesothoLiberiaLithuaniaLow incomeLower middle incomeLuxembourgMacedonia, FYRMadagascarMalawiMalaysiaMaldivesMarshall IslandsMauritaniaMauritiusMexicoMicronesia, Fed. Sts.Middle East & North AfricaMiddle East & North Africa (excluding high income)Middle East & North Africa (IDA & IBRD countries)MoldovaMongoliaMontenegroMoroccoMozambiqueMyanmarNamibiaNepalNetherlandsNew ZealandNicaraguaNigerNigeriaNorth AmericaNorwayOECD membersOmanOther small statesPacific island small statesPakistanPalauPanamaPapua New GuineaParaguayPeruPhilippinesPolandPortugalPost-demographic dividendPre-demographic dividendPuerto RicoQatarRomaniaRussian FederationRwandaSamoaSao Tome and PrincipeSaudi ArabiaSenegalSerbiaSeychellesSierra LeoneSingaporeSlovak RepublicSloveniaSmall statesSolomon IslandsSomaliaSouth AfricaSouth AsiaSouth Asia (IDA & IBRD)SpainSri LankaSt. Kitts and NevisSt. LuciaSt. Vincent and the GrenadinesSub-Saharan Africa Sub-Saharan Africa (excluding high income)Sub-Saharan Africa (IDA & IBRD countries)SudanSurinameSwazilandSwedenSwitzerlandSyrian Arab RepublicTajikistanTanzaniaThailandTimor-LesteTogoTongaTrinidad and TobagoTunisiaTurkeyTuvaluUgandaUkraineUnited Arab EmiratesUnited KingdomUnited StatesUruguayUzbekistanVanuatuVenezuela, RBVietnamWest Bank and GazaWorldZambiaZimbabwe Timeline:
This timeline shows a graph from 1967 to 2016 of Ecuador. No data until 1966. Number of actual observations by date: 50.
Source name:
World Development Indicators
Source organization:
World Bank national accounts data, and OECD National Accounts data files.
Categories, topics:
Economy & Growth
Last updated:
apr 23, 2017
Indicators value changes by year
Minimum:
-8.233
jan 1, 2000
Maximum:
25.394
jan 1, 1976
At the date of observation
Value
Absolute change
Change from previous value
jan 1, 1967
2.465
+2.465
0.0%
jan 1, 1968
5.069
+2.604
105.62%
jan 1, 1969
1.448
-3.622
-71.44%
jan 1, 1970
8.744
+7.297
504.02%
jan 1, 1971
16.031
+7.286
83.32%
jan 1, 1972
2.381
-13.65
-85.15%
jan 1, 1973
2.354
-0.027
-1.15%
jan 1, 1974
4.081
+1.728
73.4%
jan 1, 1975
10.587
+6.506
159.41%
jan 1, 1976
25.394
+14.807
139.85%
jan 1, 1977
9.163
-16.231
-63.92%
jan 1, 1978
-4.621
-13.784
-150.43%
jan 1, 1979
15.662
+20.283
-438.94%
jan 1, 1980
2.127
-13.535
-86.42%
jan 1, 1981
-1.305
-3.432
-161.35%
jan 1, 1982
15.658
+16.963
-1.3K%
jan 1, 1983
0.298
-15.36
-98.1%
jan 1, 1984
2.975
+2.677
898.06%
jan 1, 1985
0.33
-2.645
-88.91%
jan 1, 1986
3.392
+3.062
928.46%
jan 1, 1987
1.508
-1.884
-55.53%
jan 1, 1988
5.478
+3.97
263.22%
jan 1, 1989
-1.549
-7.028
-128.28%
jan 1, 1990
-0.08
+1.47
-94.86%
jan 1, 1991
10.108
+10.188
-12.79K%
jan 1, 1992
1.981
-8.128
-80.41%
jan 1, 1993
1.959
-0.022
-1.11%
jan 1, 1994
4.432
+2.474
126.32%
jan 1, 1995
6.426
+1.994
44.97%
jan 1, 1996
-3.303
-9.729
-151.4%
jan 1, 1997
6.975
+10.278
-311.16%
jan 1, 1998
-2.683
-9.658
-138.46%
jan 1, 1999
5.937
+8.62
-321.31%
jan 1, 2000
-8.233
-14.17
-238.67%
jan 1, 2001
17.238
+25.471
-309.38%
jan 1, 2002
2.276
-14.963
-86.8%
jan 1, 2003
1.769
-0.507
-22.27%
jan 1, 2004
-0.191
-1.96
-110.81%
jan 1, 2005
4.403
+4.594
-2.4K%
jan 1, 2006
4.532
+0.129
2.93%
jan 1, 2007
4.11
-0.422
-9.31%
jan 1, 2008
3.158
-0.952
-23.17%
jan 1, 2009
9.113
+5.955
188.59%
jan 1, 2010
-0.769
-9.882
-108.44%
jan 1, 2011
2.401
+3.17
-412.22%
jan 1, 2012
6.387
+3.986
166.01%
jan 1, 2013
4.088
-2.298
-35.98%
jan 1, 2014
2.159
-1.929
-47.19%
jan 1, 2015
-0.327
-2.486
-115.14%
jan 1, 2016
-0.894
-0.567
173.6%
Ranking of countries by current statistics by years


Comments: