29
/
en
AIzaSyAYiBZKx7MnpbEhh9jyipgxe19OcubqV5w
April 1, 2024
269599
Turkey
TUR
true
2
1
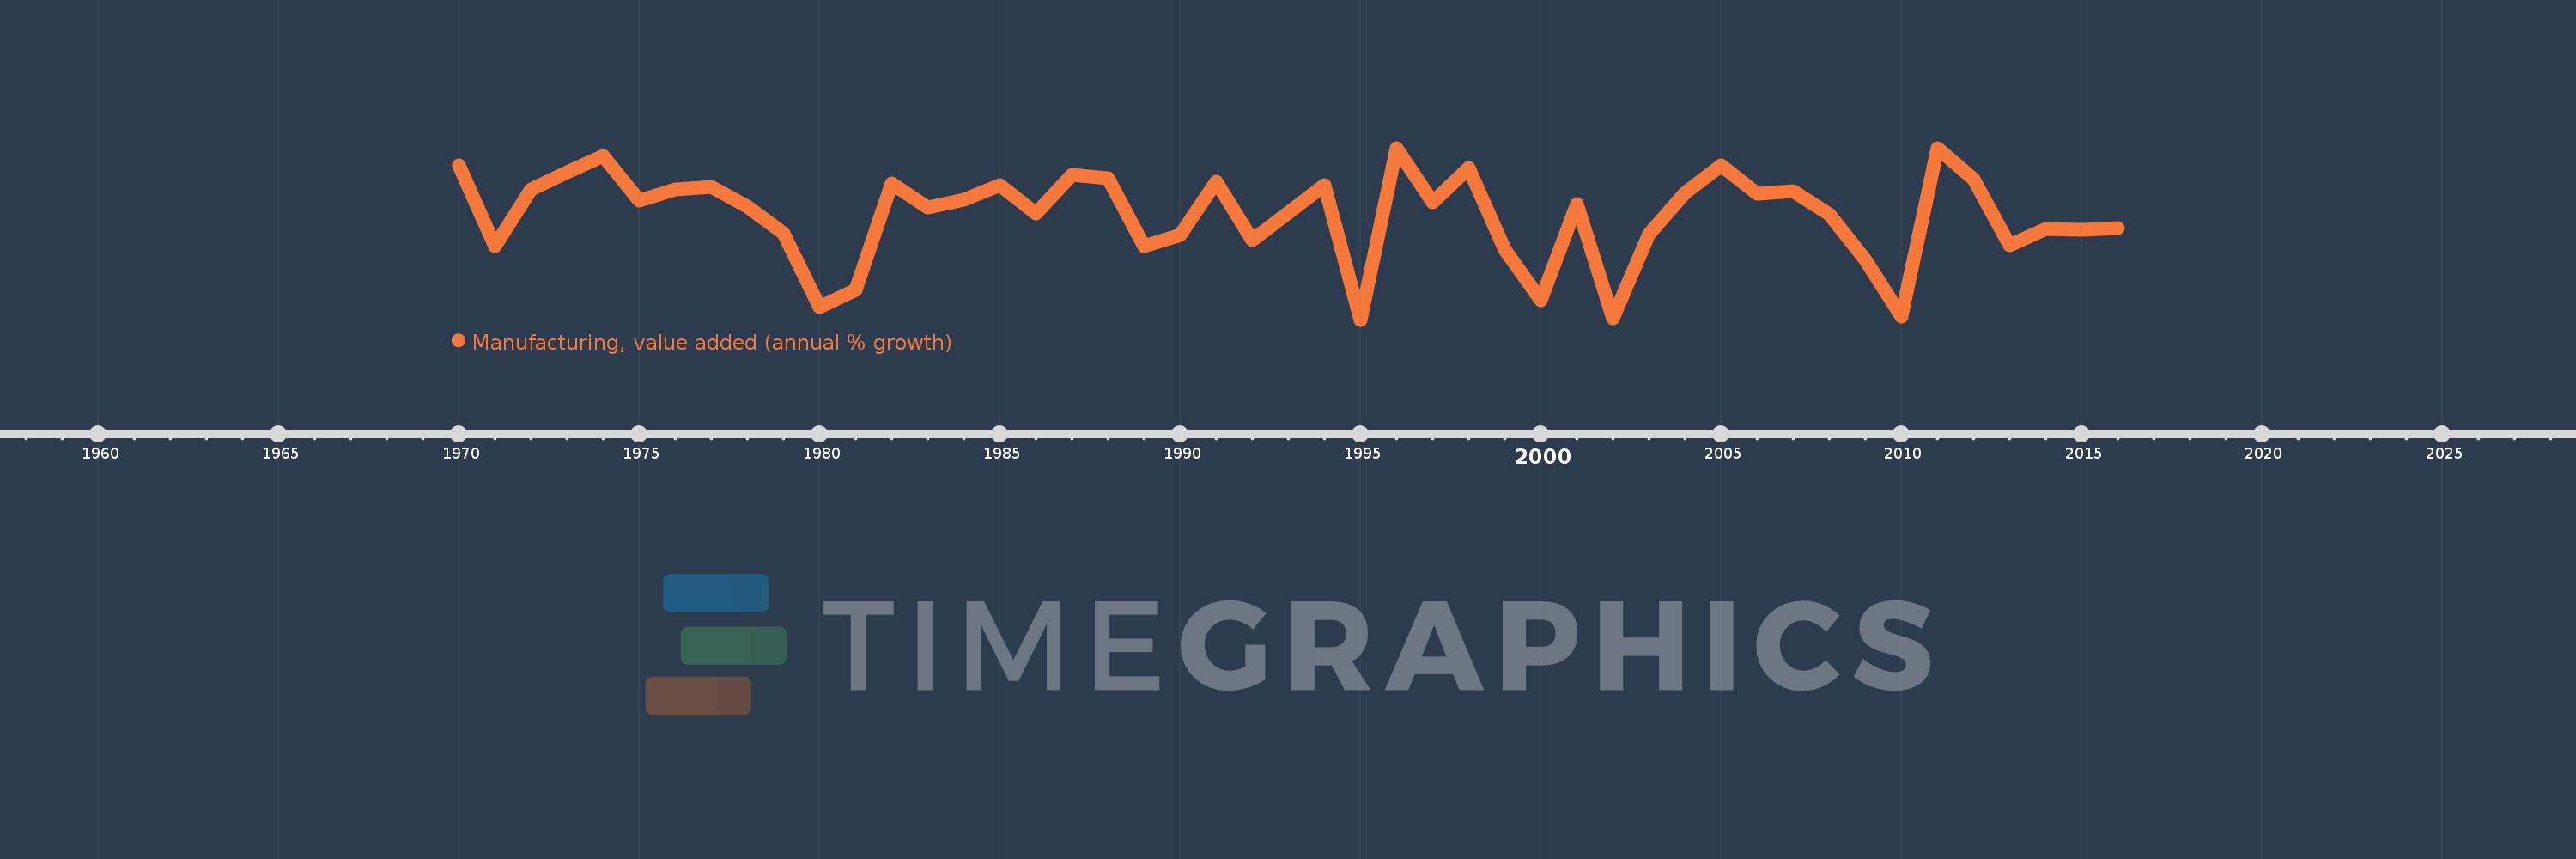
Manufacturing, value added (annual % growth)
2016,2015,2014,2013,2012,2011,2010,2009,2008,2007,2006,2005,2004,2003,2002,2001,2000,1999,1998,1997,1996,1995,1994,1993,1992,1991,1990,1989,1988,1987,1986,1985,1984,1983,1982,1981,1980,1979,1978,1977,1976,1975,1974,1973,1972,1971,1970
This statistics in other country:
AfghanistanAlbaniaAlgeriaAntigua and BarbudaArab WorldArgentinaArmeniaAustraliaAustriaAzerbaijanBahamas, TheBahrainBangladeshBelarusBelgiumBelizeBeninBermudaBhutanBoliviaBosnia and HerzegovinaBotswanaBrazilBrunei DarussalamBurkina FasoBurundiCabo VerdeCambodiaCameroonCanadaCaribbean small statesCayman IslandsCentral African RepublicCentral Europe and the BalticsChadChileColombiaComorosCongo, Dem. Rep.Congo, Rep.Costa RicaCote d'IvoireCroatiaCubaCyprusCzech RepublicDenmarkDjiboutiDominicaDominican RepublicEarly-demographic dividendEcuadorEgypt, Arab Rep.El SalvadorEquatorial GuineaEritreaEstoniaEthiopiaEuro areaEurope & Central AsiaEurope & Central Asia (excluding high income)Europe & Central Asia (IDA & IBRD countries)European UnionFijiFinlandFragile and conflict affected situationsFranceGabonGambia, TheGeorgiaGermanyGhanaGreeceGrenadaGuatemalaGuineaGuyanaHaitiHeavily indebted poor countries (HIPC)High incomeHondurasHong Kong SAR, ChinaHungaryIcelandIDA blendIDA onlyIDA totalIndiaIndonesiaIran, Islamic Rep.IraqIrelandItalyJamaicaJapanJordanKazakhstanKenyaKiribatiKorea, Rep.KosovoKuwaitKyrgyz RepublicLao PDRLatin America & Caribbean Latin America & Caribbean (excluding high income)Latin America & the Caribbean (IDA & IBRD countries)LatviaLeast developed countries: UN classificationLebanonLesothoLiberiaLithuaniaLow incomeLower middle incomeLuxembourgMacedonia, FYRMadagascarMalawiMalaysiaMaldivesMarshall IslandsMauritaniaMauritiusMexicoMicronesia, Fed. Sts.Middle East & North AfricaMiddle East & North Africa (excluding high income)Middle East & North Africa (IDA & IBRD countries)MoldovaMongoliaMontenegroMoroccoMozambiqueMyanmarNamibiaNepalNetherlandsNew ZealandNicaraguaNigerNigeriaNorth AmericaNorwayOECD membersOmanOther small statesPacific island small statesPakistanPalauPanamaPapua New GuineaParaguayPeruPhilippinesPolandPortugalPost-demographic dividendPre-demographic dividendPuerto RicoQatarRomaniaRussian FederationRwandaSamoaSao Tome and PrincipeSaudi ArabiaSenegalSerbiaSeychellesSierra LeoneSingaporeSlovak RepublicSloveniaSmall statesSolomon IslandsSomaliaSouth AfricaSouth AsiaSouth Asia (IDA & IBRD)SpainSri LankaSt. Kitts and NevisSt. LuciaSt. Vincent and the GrenadinesSub-Saharan Africa Sub-Saharan Africa (excluding high income)Sub-Saharan Africa (IDA & IBRD countries)SudanSurinameSwazilandSwedenSwitzerlandSyrian Arab RepublicTajikistanTanzaniaThailandTimor-LesteTogoTongaTrinidad and TobagoTunisiaTurkeyTuvaluUgandaUkraineUnited Arab EmiratesUnited KingdomUnited StatesUruguayUzbekistanVanuatuVenezuela, RBVietnamWest Bank and GazaWorldZambiaZimbabwe Timeline:
This timeline shows a graph from 1970 to 2016 of Turkey. No data until 1969. Number of actual observations by date: 47.
Source name:
World Development Indicators
Source organization:
World Bank national accounts data, and OECD National Accounts data files.
Categories, topics:
Economy & Growth
Last updated:
apr 23, 2017
Indicators value changes by year
Minimum:
-7.642
jan 1, 1995
Maximum:
13.914
jan 1, 1996
At the date of observation
Value
Absolute change
Change from previous value
jan 1, 1970
11.7
+11.7
0.0%
jan 1, 1971
1.6
-10.1
-86.32%
jan 1, 1972
8.7
+7.1
443.75%
jan 1, 1973
10.9
+2.2
25.29%
jan 1, 1974
12.9
+2.0
18.35%
jan 1, 1975
7.3
-5.6
-43.41%
jan 1, 1976
8.7
+1.4
19.18%
jan 1, 1977
9.0
+0.3
3.45%
jan 1, 1978
6.6
-2.4
-26.67%
jan 1, 1979
3.2
-3.4
-51.52%
jan 1, 1980
-6.1
-9.3
-290.62%
jan 1, 1981
-3.92
+2.18
-35.74%
jan 1, 1982
9.44
+13.36
-340.82%
jan 1, 1983
6.42
-3.02
-31.99%
jan 1, 1984
7.46
+1.04
16.2%
jan 1, 1985
9.25
+1.79
23.99%
jan 1, 1986
5.7
-3.55
-38.38%
jan 1, 1987
10.5
+4.8
84.21%
jan 1, 1988
10.06
-0.44
-4.19%
jan 1, 1989
1.573
-8.487
-84.36%
jan 1, 1990
3.021
+1.447
92.01%
jan 1, 1991
9.681
+6.66
220.5%
jan 1, 1992
2.38
-7.3
-75.41%
jan 1, 1993
5.769
+3.389
142.37%
jan 1, 1994
9.296
+3.527
61.13%
jan 1, 1995
-7.642
-16.938
-182.2%
jan 1, 1996
13.914
+21.556
-282.08%
jan 1, 1997
7.112
-6.802
-48.88%
jan 1, 1998
11.445
+4.333
60.93%
jan 1, 1999
1.174
-10.272
-89.74%
jan 1, 2000
-5.19
-6.364
-542.09%
jan 1, 2001
6.884
+12.074
-232.65%
jan 1, 2002
-7.499
-14.383
-208.92%
jan 1, 2003
3.057
+10.556
-140.77%
jan 1, 2004
8.289
+5.232
171.15%
jan 1, 2005
11.691
+3.402
41.05%
jan 1, 2006
8.211
-3.481
-29.77%
jan 1, 2007
8.464
+0.254
3.09%
jan 1, 2008
5.631
-2.833
-33.47%
jan 1, 2009
-0.112
-5.743
-101.98%
jan 1, 2010
-7.251
-7.14
6.4K%
jan 1, 2011
13.834
+21.085
-290.78%
jan 1, 2012
9.998
-3.836
-27.73%
jan 1, 2013
1.72
-8.279
-82.8%
jan 1, 2014
3.724
+2.005
116.57%
jan 1, 2015
3.651
-0.073
-1.95%
jan 1, 2016
3.813
+0.161
4.42%
Ranking of countries by current statistics by years


Comments: