29
/
en
AIzaSyAYiBZKx7MnpbEhh9jyipgxe19OcubqV5w
April 1, 2024
133377
Finland
FIN
true
2
1
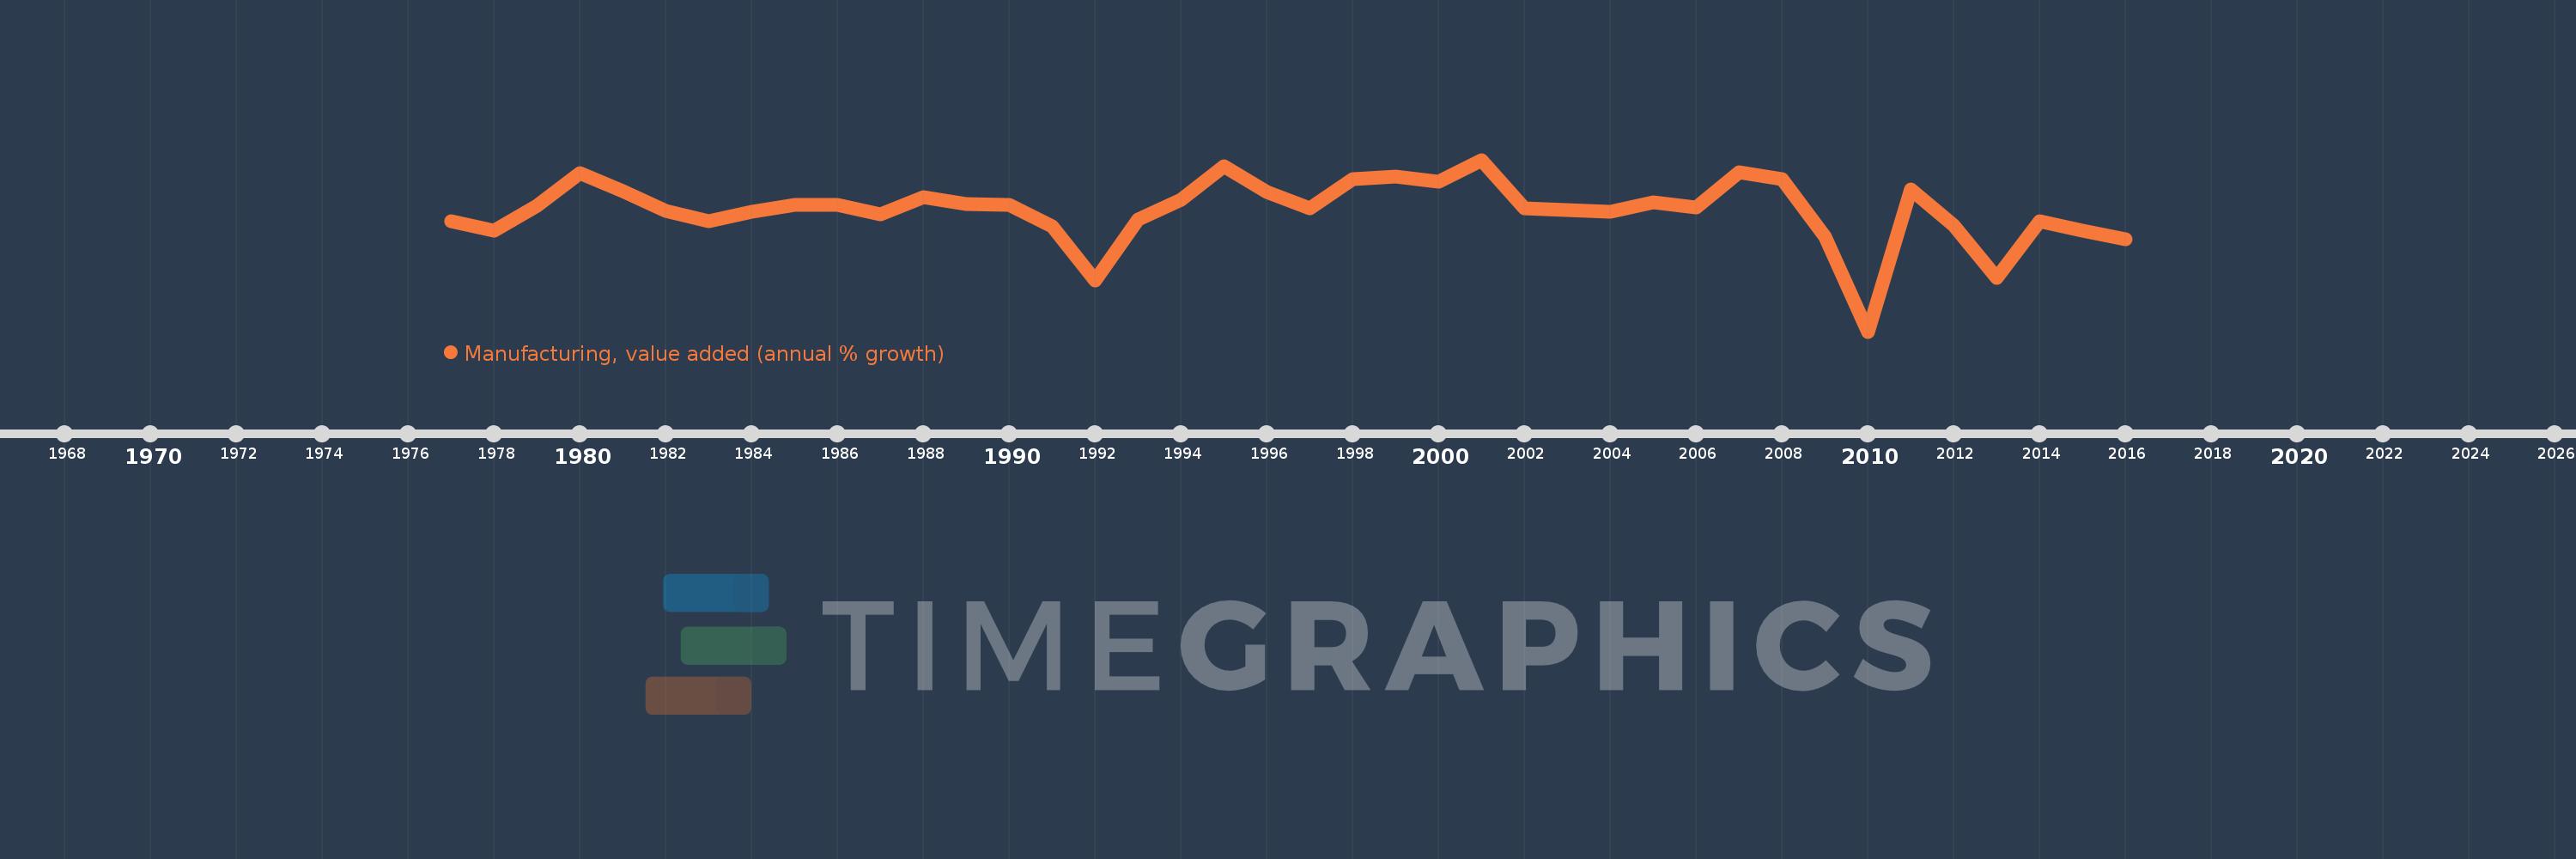
Manufacturing, value added (annual % growth)
2016,2015,2014,2013,2012,2011,2010,2009,2008,2007,2006,2005,2004,2003,2002,2001,2000,1999,1998,1997,1996,1995,1994,1993,1992,1991,1990,1989,1988,1987,1986,1985,1984,1983,1982,1981,1980,1979,1978,1977
This statistics in other country:
AfghanistanAlbaniaAlgeriaAntigua and BarbudaArab WorldArgentinaArmeniaAustraliaAustriaAzerbaijanBahamas, TheBahrainBangladeshBelarusBelgiumBelizeBeninBermudaBhutanBoliviaBosnia and HerzegovinaBotswanaBrazilBrunei DarussalamBurkina FasoBurundiCabo VerdeCambodiaCameroonCanadaCaribbean small statesCayman IslandsCentral African RepublicCentral Europe and the BalticsChadChileColombiaComorosCongo, Dem. Rep.Congo, Rep.Costa RicaCote d'IvoireCroatiaCubaCyprusCzech RepublicDenmarkDjiboutiDominicaDominican RepublicEarly-demographic dividendEcuadorEgypt, Arab Rep.El SalvadorEquatorial GuineaEritreaEstoniaEthiopiaEuro areaEurope & Central AsiaEurope & Central Asia (excluding high income)Europe & Central Asia (IDA & IBRD countries)European UnionFijiFinlandFragile and conflict affected situationsFranceGabonGambia, TheGeorgiaGermanyGhanaGreeceGrenadaGuatemalaGuineaGuyanaHaitiHeavily indebted poor countries (HIPC)High incomeHondurasHong Kong SAR, ChinaHungaryIcelandIDA blendIDA onlyIDA totalIndiaIndonesiaIran, Islamic Rep.IraqIrelandItalyJamaicaJapanJordanKazakhstanKenyaKiribatiKorea, Rep.KosovoKuwaitKyrgyz RepublicLao PDRLatin America & Caribbean Latin America & Caribbean (excluding high income)Latin America & the Caribbean (IDA & IBRD countries)LatviaLeast developed countries: UN classificationLebanonLesothoLiberiaLithuaniaLow incomeLower middle incomeLuxembourgMacedonia, FYRMadagascarMalawiMalaysiaMaldivesMarshall IslandsMauritaniaMauritiusMexicoMicronesia, Fed. Sts.Middle East & North AfricaMiddle East & North Africa (excluding high income)Middle East & North Africa (IDA & IBRD countries)MoldovaMongoliaMontenegroMoroccoMozambiqueMyanmarNamibiaNepalNetherlandsNew ZealandNicaraguaNigerNigeriaNorth AmericaNorwayOECD membersOmanOther small statesPacific island small statesPakistanPalauPanamaPapua New GuineaParaguayPeruPhilippinesPolandPortugalPost-demographic dividendPre-demographic dividendPuerto RicoQatarRomaniaRussian FederationRwandaSamoaSao Tome and PrincipeSaudi ArabiaSenegalSerbiaSeychellesSierra LeoneSingaporeSlovak RepublicSloveniaSmall statesSolomon IslandsSomaliaSouth AfricaSouth AsiaSouth Asia (IDA & IBRD)SpainSri LankaSt. Kitts and NevisSt. LuciaSt. Vincent and the GrenadinesSub-Saharan Africa Sub-Saharan Africa (excluding high income)Sub-Saharan Africa (IDA & IBRD countries)SudanSurinameSwazilandSwedenSwitzerlandSyrian Arab RepublicTajikistanTanzaniaThailandTimor-LesteTogoTongaTrinidad and TobagoTunisiaTurkeyTuvaluUgandaUkraineUnited Arab EmiratesUnited KingdomUnited StatesUruguayUzbekistanVanuatuVenezuela, RBVietnamWest Bank and GazaWorldZambiaZimbabwe Timeline:
This timeline shows a graph from 1977 to 2016 of Finland. No data until 1976. Number of actual observations by date: 40.
Source name:
World Development Indicators
Source organization:
World Bank national accounts data, and OECD National Accounts data files.
Categories, topics:
Economy & Growth
Last updated:
apr 23, 2017
Indicators value changes by year
Minimum:
-23.232
jan 1, 2010
Maximum:
14.205
jan 1, 2001
At the date of observation
Value
Absolute change
Change from previous value
jan 1, 1977
0.758
+0.758
0.0%
jan 1, 1978
-1.187
-1.945
-256.51%
jan 1, 1979
4.14
+5.327
-448.86%
jan 1, 1980
11.326
+7.186
173.58%
jan 1, 1981
7.377
-3.948
-34.86%
jan 1, 1982
3.118
-4.26
-57.74%
jan 1, 1983
0.908
-2.21
-70.88%
jan 1, 1984
2.795
+1.887
207.88%
jan 1, 1985
4.453
+1.658
59.3%
jan 1, 1986
4.336
-0.117
-2.62%
jan 1, 1987
2.261
-2.075
-47.85%
jan 1, 1988
5.97
+3.709
164.03%
jan 1, 1989
4.475
-1.495
-25.04%
jan 1, 1990
4.456
-0.02
-0.44%
jan 1, 1991
-0.264
-4.72
-105.92%
jan 1, 1992
-12.104
-11.84
4.49K%
jan 1, 1993
1.226
+13.33
-110.13%
jan 1, 1994
5.446
+4.22
344.25%
jan 1, 1995
12.782
+7.336
134.69%
jan 1, 1996
7.11
-5.672
-44.38%
jan 1, 1997
3.587
-3.523
-49.55%
jan 1, 1998
9.972
+6.385
178.0%
jan 1, 1999
10.527
+0.555
5.57%
jan 1, 2000
9.418
-1.109
-10.54%
jan 1, 2001
14.205
+4.787
50.82%
jan 1, 2002
3.618
-10.586
-74.53%
jan 1, 2003
3.324
-0.295
-8.14%
jan 1, 2004
2.878
-0.446
-13.43%
jan 1, 2005
4.894
+2.016
70.08%
jan 1, 2006
3.815
-1.079
-22.04%
jan 1, 2007
11.427
+7.612
199.51%
jan 1, 2008
10.086
-1.341
-11.74%
jan 1, 2009
-2.613
-12.699
-125.91%
jan 1, 2010
-23.232
-20.619
789.1%
jan 1, 2011
7.678
+30.91
-133.05%
jan 1, 2012
-0.113
-7.79
-101.47%
jan 1, 2013
-11.45
-11.338
10.06K%
jan 1, 2014
0.846
+12.296
-107.39%
jan 1, 2015
-1.33
-2.176
-257.25%
jan 1, 2016
-3.08
-1.75
131.58%
Ranking of countries by current statistics by years


Comments: