29
/
en
AIzaSyAYiBZKx7MnpbEhh9jyipgxe19OcubqV5w
April 1, 2024
167754
Kenya
KEN
true
2
1
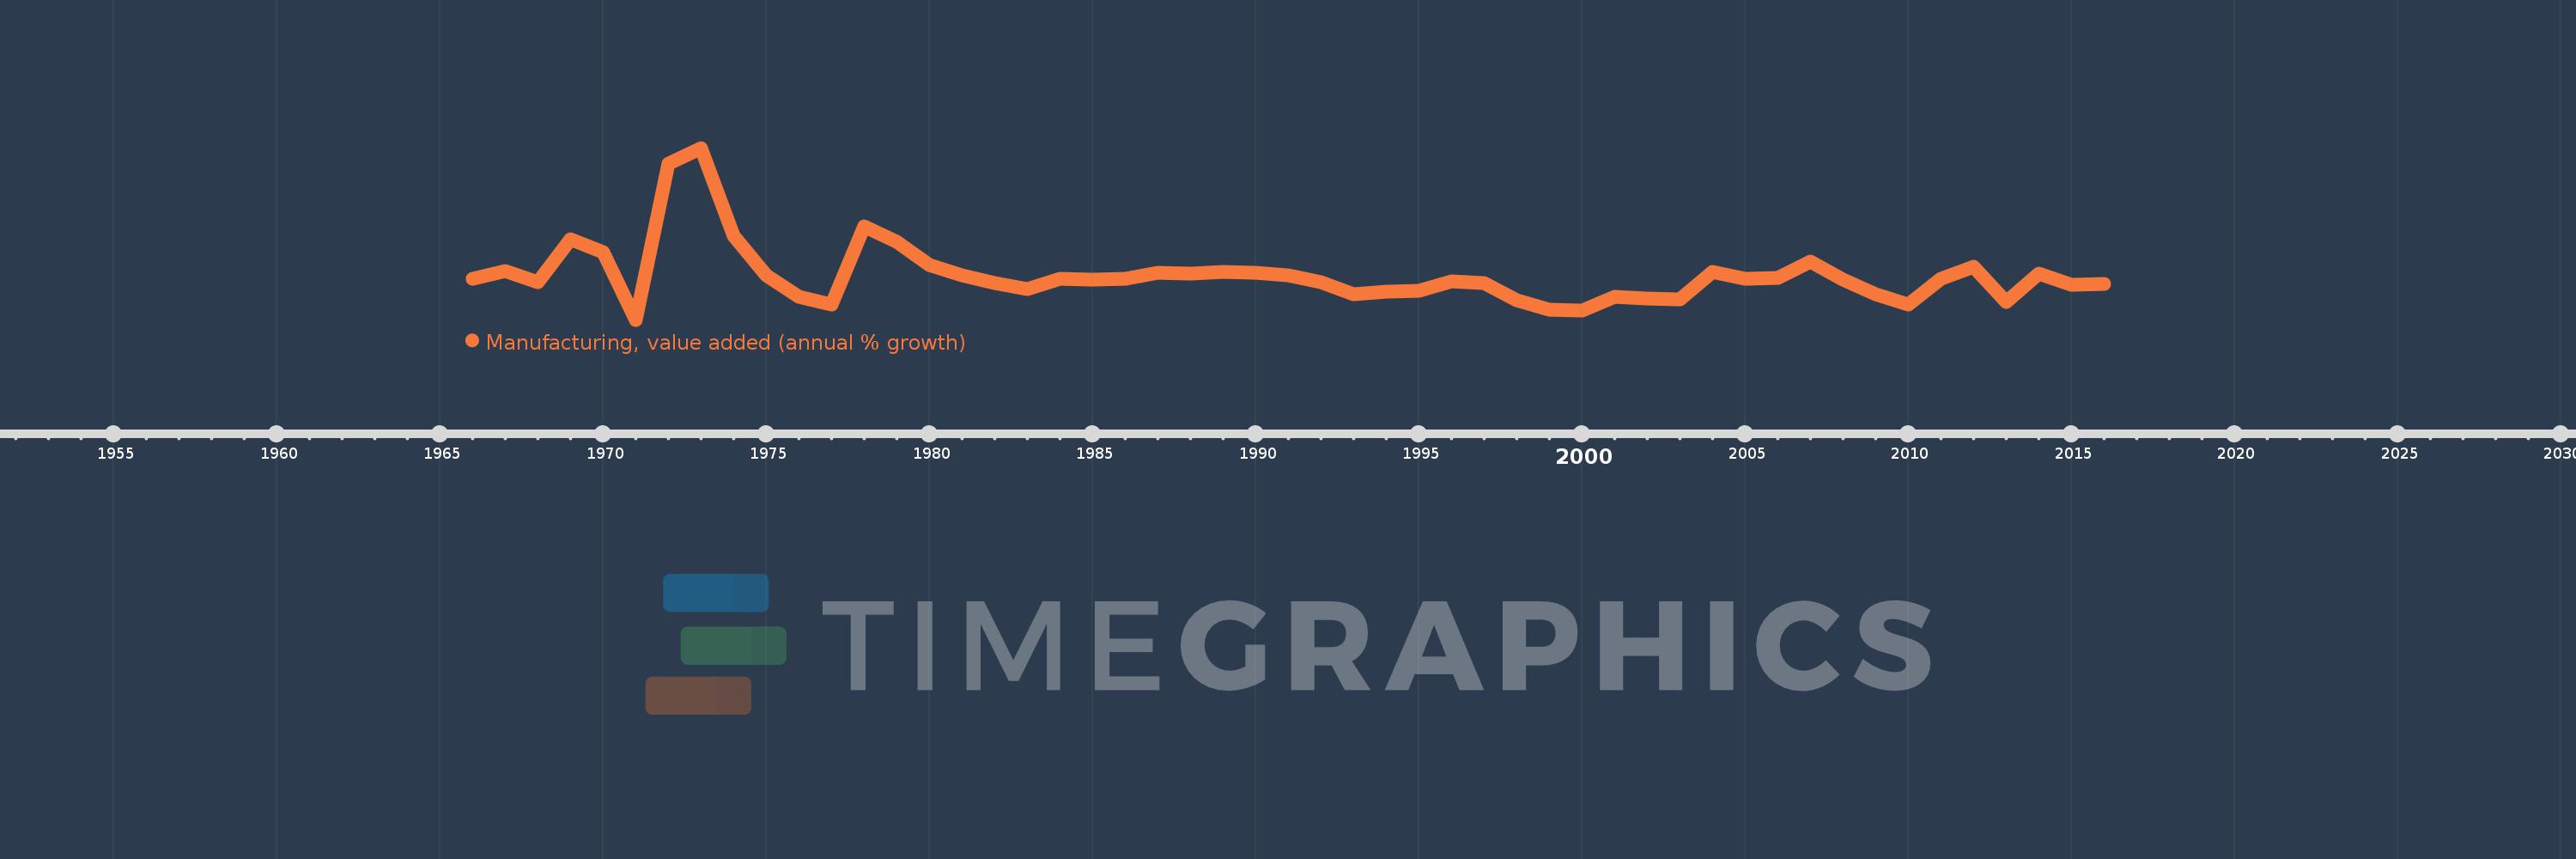
Manufacturing, value added (annual % growth)
2016,2015,2014,2013,2012,2011,2010,2009,2008,2007,2006,2005,2004,2003,2002,2001,2000,1999,1998,1997,1996,1995,1994,1993,1992,1991,1990,1989,1988,1987,1986,1985,1984,1983,1982,1981,1980,1979,1978,1977,1976,1975,1974,1973,1972,1971,1970,1969,1968,1967,1966
This statistics in other country:
AfghanistanAlbaniaAlgeriaAntigua and BarbudaArab WorldArgentinaArmeniaAustraliaAustriaAzerbaijanBahamas, TheBahrainBangladeshBelarusBelgiumBelizeBeninBermudaBhutanBoliviaBosnia and HerzegovinaBotswanaBrazilBrunei DarussalamBurkina FasoBurundiCabo VerdeCambodiaCameroonCanadaCaribbean small statesCayman IslandsCentral African RepublicCentral Europe and the BalticsChadChileColombiaComorosCongo, Dem. Rep.Congo, Rep.Costa RicaCote d'IvoireCroatiaCubaCyprusCzech RepublicDenmarkDjiboutiDominicaDominican RepublicEarly-demographic dividendEcuadorEgypt, Arab Rep.El SalvadorEquatorial GuineaEritreaEstoniaEthiopiaEuro areaEurope & Central AsiaEurope & Central Asia (excluding high income)Europe & Central Asia (IDA & IBRD countries)European UnionFijiFinlandFragile and conflict affected situationsFranceGabonGambia, TheGeorgiaGermanyGhanaGreeceGrenadaGuatemalaGuineaGuyanaHaitiHeavily indebted poor countries (HIPC)High incomeHondurasHong Kong SAR, ChinaHungaryIcelandIDA blendIDA onlyIDA totalIndiaIndonesiaIran, Islamic Rep.IraqIrelandItalyJamaicaJapanJordanKazakhstanKenyaKiribatiKorea, Rep.KosovoKuwaitKyrgyz RepublicLao PDRLatin America & Caribbean Latin America & Caribbean (excluding high income)Latin America & the Caribbean (IDA & IBRD countries)LatviaLeast developed countries: UN classificationLebanonLesothoLiberiaLithuaniaLow incomeLower middle incomeLuxembourgMacedonia, FYRMadagascarMalawiMalaysiaMaldivesMarshall IslandsMauritaniaMauritiusMexicoMicronesia, Fed. Sts.Middle East & North AfricaMiddle East & North Africa (excluding high income)Middle East & North Africa (IDA & IBRD countries)MoldovaMongoliaMontenegroMoroccoMozambiqueMyanmarNamibiaNepalNetherlandsNew ZealandNicaraguaNigerNigeriaNorth AmericaNorwayOECD membersOmanOther small statesPacific island small statesPakistanPalauPanamaPapua New GuineaParaguayPeruPhilippinesPolandPortugalPost-demographic dividendPre-demographic dividendPuerto RicoQatarRomaniaRussian FederationRwandaSamoaSao Tome and PrincipeSaudi ArabiaSenegalSerbiaSeychellesSierra LeoneSingaporeSlovak RepublicSloveniaSmall statesSolomon IslandsSomaliaSouth AfricaSouth AsiaSouth Asia (IDA & IBRD)SpainSri LankaSt. Kitts and NevisSt. LuciaSt. Vincent and the GrenadinesSub-Saharan Africa Sub-Saharan Africa (excluding high income)Sub-Saharan Africa (IDA & IBRD countries)SudanSurinameSwazilandSwedenSwitzerlandSyrian Arab RepublicTajikistanTanzaniaThailandTimor-LesteTogoTongaTrinidad and TobagoTunisiaTurkeyTuvaluUgandaUkraineUnited Arab EmiratesUnited KingdomUnited StatesUruguayUzbekistanVanuatuVenezuela, RBVietnamWest Bank and GazaWorldZambiaZimbabwe Timeline:
This timeline shows a graph from 1966 to 2016 of Kenya. No data until 1965. Number of actual observations by date: 51.
Source name:
World Development Indicators
Source organization:
World Bank national accounts data, and OECD National Accounts data files.
Categories, topics:
Economy & Growth
Last updated:
apr 23, 2017
Indicators value changes by year
Maximum:
32.868
jan 1, 1973
At the date of observation
Value
Absolute change
Change from previous value
jan 1, 1966
4.479
+4.479
0.0%
jan 1, 1967
6.179
+1.7
37.94%
jan 1, 1968
3.856
-2.322
-37.59%
jan 1, 1969
13.194
+9.338
242.13%
jan 1, 1970
10.272
-2.922
-22.14%
jan 1, 1971
-4.32
-14.593
-142.06%
jan 1, 1972
29.462
+33.782
-781.94%
jan 1, 1973
32.868
+3.407
11.56%
jan 1, 1974
13.82
-19.048
-57.95%
jan 1, 1975
5.239
-8.581
-62.09%
jan 1, 1976
0.599
-4.64
-88.57%
jan 1, 1977
-1.089
-1.688
-281.84%
jan 1, 1978
15.895
+16.984
-1.56K%
jan 1, 1979
12.508
-3.387
-21.31%
jan 1, 1980
7.458
-5.05
-40.38%
jan 1, 1981
5.24
-2.218
-29.74%
jan 1, 1982
3.585
-1.655
-31.59%
jan 1, 1983
2.252
-1.332
-37.17%
jan 1, 1984
4.504
+2.252
100.01%
jan 1, 1985
4.31
-0.194
-4.31%
jan 1, 1986
4.492
+0.182
4.21%
jan 1, 1987
5.801
+1.309
29.14%
jan 1, 1988
5.721
-0.08
-1.37%
jan 1, 1989
6.0
+0.279
4.87%
jan 1, 1990
5.901
-0.099
-1.65%
jan 1, 1991
5.234
-0.667
-11.3%
jan 1, 1992
3.799
-1.435
-27.41%
jan 1, 1993
1.2
-2.599
-68.41%
jan 1, 1994
1.801
+0.601
50.06%
jan 1, 1995
1.899
+0.098
5.46%
jan 1, 1996
3.9
+2.0
105.33%
jan 1, 1997
3.668
-0.231
-5.94%
jan 1, 1998
-0.041
-3.709
-101.11%
jan 1, 1999
-2.115
-2.075
5.11K%
jan 1, 2000
-2.32
-0.205
9.69%
jan 1, 2001
0.68
+3.0
-129.31%
jan 1, 2002
0.294
-0.387
-56.84%
jan 1, 2003
0.081
-0.212
-72.34%
jan 1, 2004
5.972
+5.891
7.26K%
jan 1, 2005
4.462
-1.51
-25.29%
jan 1, 2006
4.662
+0.2
4.49%
jan 1, 2007
8.208
+3.546
76.05%
jan 1, 2008
4.376
-3.832
-46.69%
jan 1, 2009
1.142
-3.233
-73.89%
jan 1, 2010
-1.053
-2.195
-192.17%
jan 1, 2011
4.503
+5.556
-527.69%
jan 1, 2012
7.245
+2.741
60.88%
jan 1, 2013
-0.557
-7.802
-107.69%
jan 1, 2014
5.601
+6.158
-1.1K%
jan 1, 2015
3.199
-2.401
-42.87%
jan 1, 2016
3.459
+0.26
8.12%
Ranking of countries by current statistics by years


Comments: