29
/
en
AIzaSyAYiBZKx7MnpbEhh9jyipgxe19OcubqV5w
April 1, 2024
158638
Iraq
IRQ
true
2
1
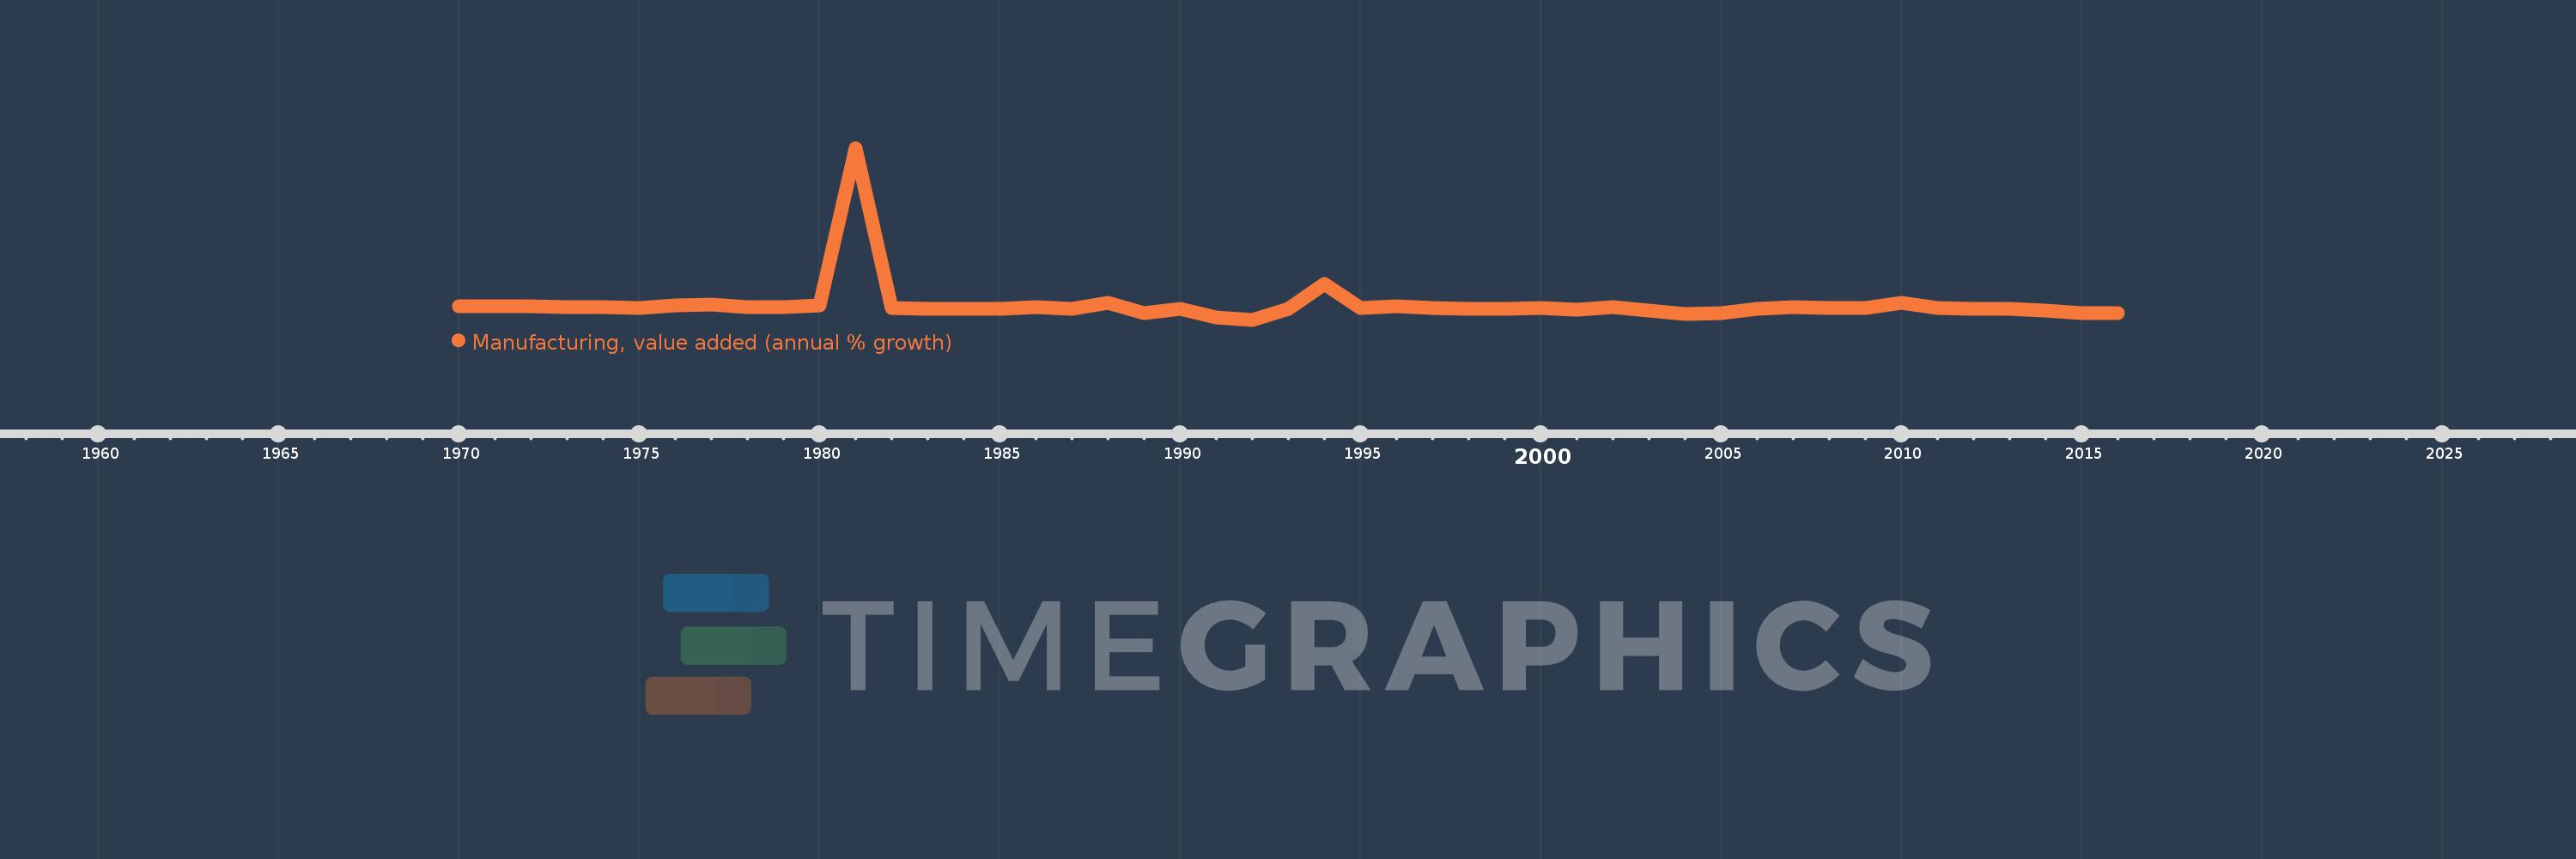
Manufacturing, value added (annual % growth)
2016,2015,2014,2013,2012,2011,2010,2009,2008,2007,2006,2005,2004,2003,2002,2001,2000,1999,1998,1997,1996,1995,1994,1993,1992,1991,1990,1989,1988,1987,1986,1985,1984,1983,1982,1981,1980,1979,1978,1977,1976,1975,1974,1973,1972,1971,1970
This statistics in other country:
AfghanistanAlbaniaAlgeriaAntigua and BarbudaArab WorldArgentinaArmeniaAustraliaAustriaAzerbaijanBahamas, TheBahrainBangladeshBelarusBelgiumBelizeBeninBermudaBhutanBoliviaBosnia and HerzegovinaBotswanaBrazilBrunei DarussalamBurkina FasoBurundiCabo VerdeCambodiaCameroonCanadaCaribbean small statesCayman IslandsCentral African RepublicCentral Europe and the BalticsChadChileColombiaComorosCongo, Dem. Rep.Congo, Rep.Costa RicaCote d'IvoireCroatiaCubaCyprusCzech RepublicDenmarkDjiboutiDominicaDominican RepublicEarly-demographic dividendEcuadorEgypt, Arab Rep.El SalvadorEquatorial GuineaEritreaEstoniaEthiopiaEuro areaEurope & Central AsiaEurope & Central Asia (excluding high income)Europe & Central Asia (IDA & IBRD countries)European UnionFijiFinlandFragile and conflict affected situationsFranceGabonGambia, TheGeorgiaGermanyGhanaGreeceGrenadaGuatemalaGuineaGuyanaHaitiHeavily indebted poor countries (HIPC)High incomeHondurasHong Kong SAR, ChinaHungaryIcelandIDA blendIDA onlyIDA totalIndiaIndonesiaIran, Islamic Rep.IraqIrelandItalyJamaicaJapanJordanKazakhstanKenyaKiribatiKorea, Rep.KosovoKuwaitKyrgyz RepublicLao PDRLatin America & Caribbean Latin America & Caribbean (excluding high income)Latin America & the Caribbean (IDA & IBRD countries)LatviaLeast developed countries: UN classificationLebanonLesothoLiberiaLithuaniaLow incomeLower middle incomeLuxembourgMacedonia, FYRMadagascarMalawiMalaysiaMaldivesMarshall IslandsMauritaniaMauritiusMexicoMicronesia, Fed. Sts.Middle East & North AfricaMiddle East & North Africa (excluding high income)Middle East & North Africa (IDA & IBRD countries)MoldovaMongoliaMontenegroMoroccoMozambiqueMyanmarNamibiaNepalNetherlandsNew ZealandNicaraguaNigerNigeriaNorth AmericaNorwayOECD membersOmanOther small statesPacific island small statesPakistanPalauPanamaPapua New GuineaParaguayPeruPhilippinesPolandPortugalPost-demographic dividendPre-demographic dividendPuerto RicoQatarRomaniaRussian FederationRwandaSamoaSao Tome and PrincipeSaudi ArabiaSenegalSerbiaSeychellesSierra LeoneSingaporeSlovak RepublicSloveniaSmall statesSolomon IslandsSomaliaSouth AfricaSouth AsiaSouth Asia (IDA & IBRD)SpainSri LankaSt. Kitts and NevisSt. LuciaSt. Vincent and the GrenadinesSub-Saharan Africa Sub-Saharan Africa (excluding high income)Sub-Saharan Africa (IDA & IBRD countries)SudanSurinameSwazilandSwedenSwitzerlandSyrian Arab RepublicTajikistanTanzaniaThailandTimor-LesteTogoTongaTrinidad and TobagoTunisiaTurkeyTuvaluUgandaUkraineUnited Arab EmiratesUnited KingdomUnited StatesUruguayUzbekistanVanuatuVenezuela, RBVietnamWest Bank and GazaWorldZambiaZimbabwe Timeline:
This timeline shows a graph from 1970 to 2016 of Iraq. No data until 1969. Number of actual observations by date: 47.
Source name:
World Development Indicators
Source organization:
World Bank national accounts data, and OECD National Accounts data files.
Categories, topics:
Economy & Growth
Last updated:
apr 23, 2017
Indicators value changes by year
Minimum:
-61.93
jan 1, 1992
Maximum:
913.135
jan 1, 1981
At the date of observation
Value
Absolute change
Change from previous value
jan 1, 1970
14.09
+14.09
0.0%
jan 1, 1971
15.78
+1.69
12.0%
jan 1, 1972
16.444
+0.664
4.21%
jan 1, 1973
8.397
-8.047
-48.94%
jan 1, 1974
8.099
-0.298
-3.55%
jan 1, 1975
4.669
-3.43
-42.35%
jan 1, 1976
21.577
+16.908
362.14%
jan 1, 1977
23.464
+1.887
8.75%
jan 1, 1978
11.679
-11.785
-50.22%
jan 1, 1979
9.963
-1.716
-14.7%
jan 1, 1980
17.389
+7.426
74.54%
jan 1, 1981
913.135
+895.746
5.15K%
jan 1, 1982
5.858
-907.277
-99.36%
jan 1, 1983
1.225
-4.633
-79.09%
jan 1, 1984
0.888
-0.337
-27.53%
jan 1, 1985
-1.16
-2.047
-230.68%
jan 1, 1986
11.642
+12.802
-1.1K%
jan 1, 1987
-1.075
-12.717
-109.23%
jan 1, 1988
36.359
+37.434
-3.48K%
jan 1, 1989
-22.342
-58.701
-161.45%
jan 1, 1990
0.901
+23.243
-104.03%
jan 1, 1991
-46.919
-47.82
-5.31K%
jan 1, 1992
-61.93
-15.011
31.99%
jan 1, 1993
2.136
+64.066
-103.45%
jan 1, 1994
140.582
+138.446
6.48K%
jan 1, 1995
4.036
-136.546
-97.13%
jan 1, 1996
16.366
+12.331
305.54%
jan 1, 1997
4.395
-11.972
-73.15%
jan 1, 1998
2.177
-2.218
-50.47%
jan 1, 1999
1.393
-0.784
-36.01%
jan 1, 2000
5.639
+4.246
304.86%
jan 1, 2001
-4.475
-10.114
-179.35%
jan 1, 2002
9.215
+13.69
-305.92%
jan 1, 2003
-8.851
-18.066
-196.05%
jan 1, 2004
-28.528
-19.677
222.31%
jan 1, 2005
-22.293
+6.235
-21.86%
jan 1, 2006
-1.097
+21.196
-95.08%
jan 1, 2007
10.502
+11.599
-1.06K%
jan 1, 2008
6.248
-4.254
-40.51%
jan 1, 2009
6.7
+0.452
7.24%
jan 1, 2010
35.989
+29.289
437.15%
jan 1, 2011
6.34
-29.648
-82.38%
jan 1, 2012
2.333
-4.007
-63.2%
jan 1, 2013
2.1
-0.233
-9.99%
jan 1, 2014
-7.8
-9.9
-471.43%
jan 1, 2015
-22.2
-14.4
184.62%
jan 1, 2016
-22.9
-0.7
3.15%
Ranking of countries by current statistics by years


Comments: