29
/
en
AIzaSyAYiBZKx7MnpbEhh9jyipgxe19OcubqV5w
April 1, 2024
268253
Tunisia
TUN
true
2
1
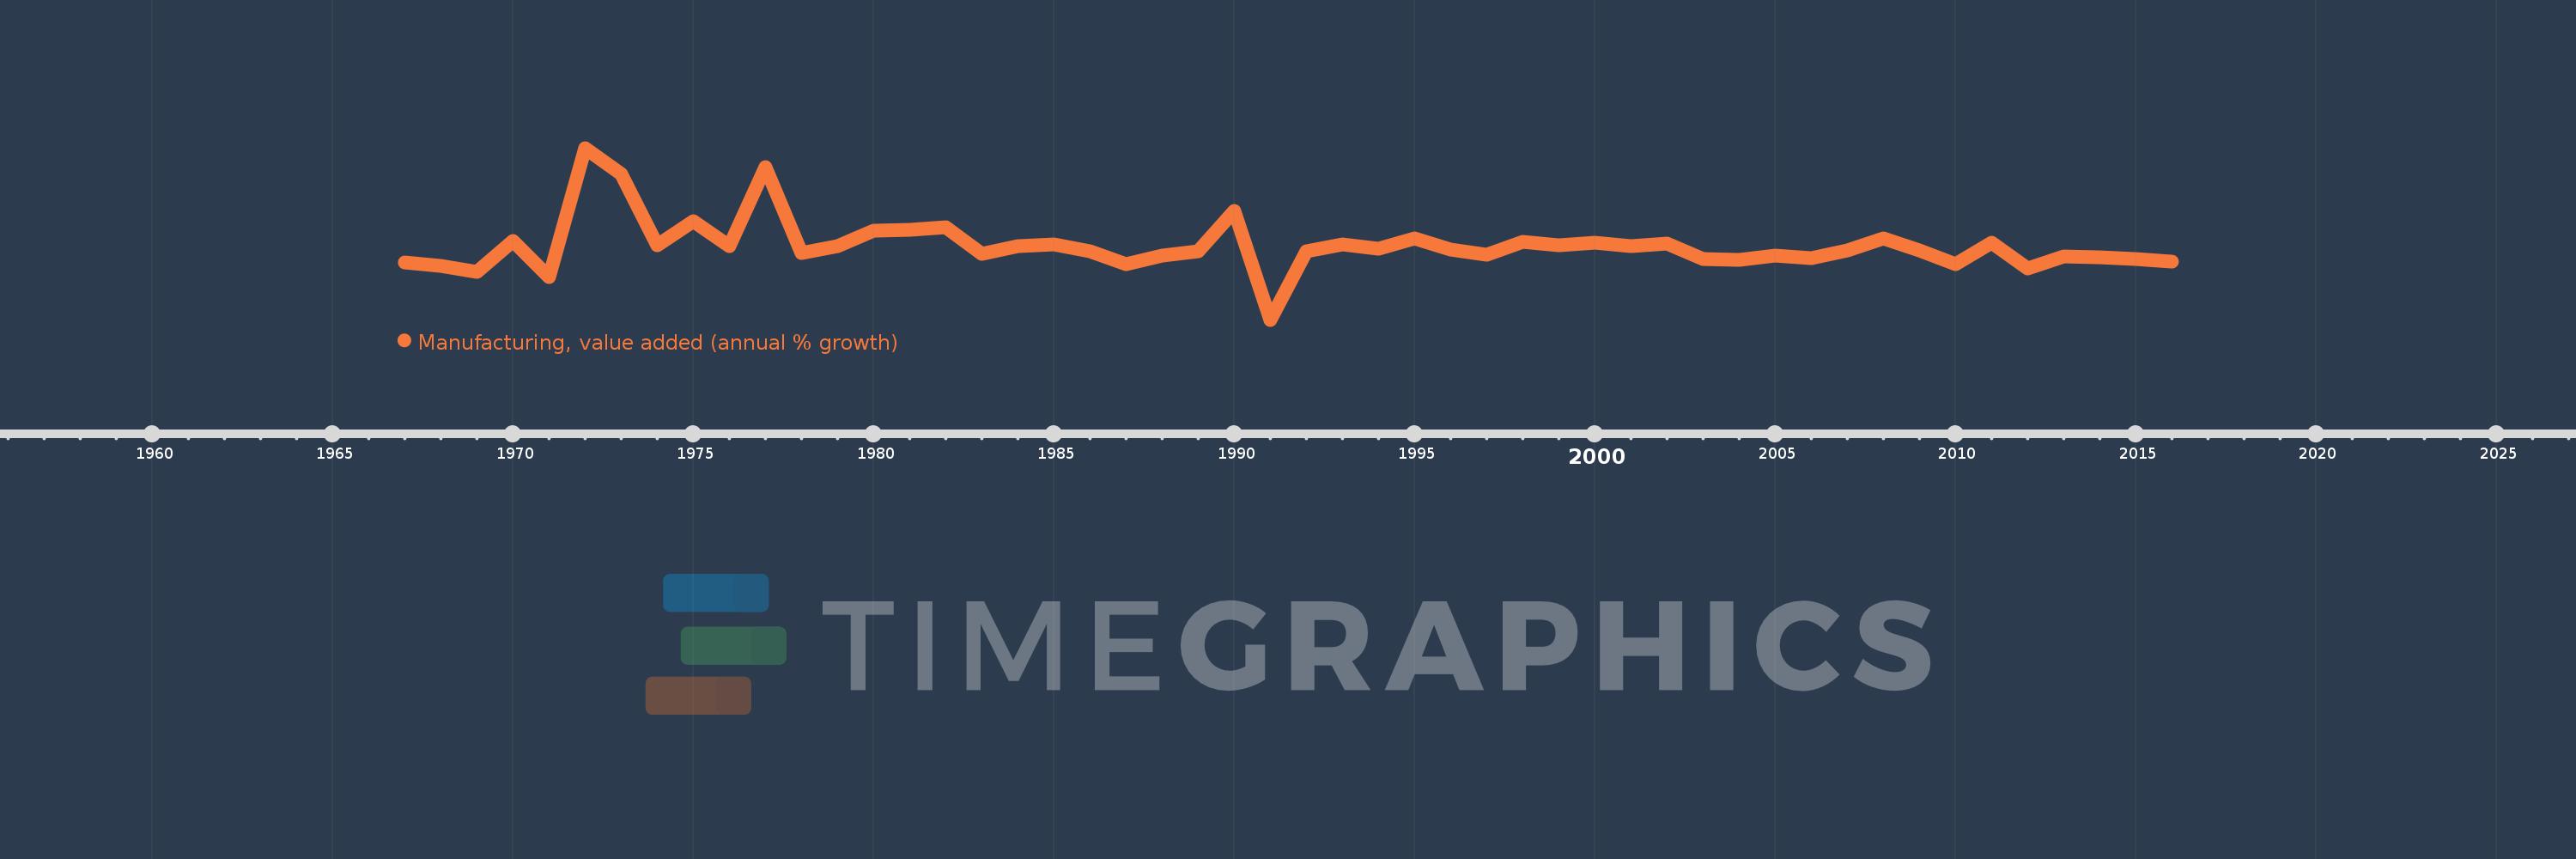
Manufacturing, value added (annual % growth)
2016,2015,2014,2013,2012,2011,2010,2009,2008,2007,2006,2005,2004,2003,2002,2001,2000,1999,1998,1997,1996,1995,1994,1993,1992,1991,1990,1989,1988,1987,1986,1985,1984,1983,1982,1981,1980,1979,1978,1977,1976,1975,1974,1973,1972,1971,1970,1969,1968,1967
This statistics in other country:
AfghanistanAlbaniaAlgeriaAntigua and BarbudaArab WorldArgentinaArmeniaAustraliaAustriaAzerbaijanBahamas, TheBahrainBangladeshBelarusBelgiumBelizeBeninBermudaBhutanBoliviaBosnia and HerzegovinaBotswanaBrazilBrunei DarussalamBurkina FasoBurundiCabo VerdeCambodiaCameroonCanadaCaribbean small statesCayman IslandsCentral African RepublicCentral Europe and the BalticsChadChileColombiaComorosCongo, Dem. Rep.Congo, Rep.Costa RicaCote d'IvoireCroatiaCubaCyprusCzech RepublicDenmarkDjiboutiDominicaDominican RepublicEarly-demographic dividendEcuadorEgypt, Arab Rep.El SalvadorEquatorial GuineaEritreaEstoniaEthiopiaEuro areaEurope & Central AsiaEurope & Central Asia (excluding high income)Europe & Central Asia (IDA & IBRD countries)European UnionFijiFinlandFragile and conflict affected situationsFranceGabonGambia, TheGeorgiaGermanyGhanaGreeceGrenadaGuatemalaGuineaGuyanaHaitiHeavily indebted poor countries (HIPC)High incomeHondurasHong Kong SAR, ChinaHungaryIcelandIDA blendIDA onlyIDA totalIndiaIndonesiaIran, Islamic Rep.IraqIrelandItalyJamaicaJapanJordanKazakhstanKenyaKiribatiKorea, Rep.KosovoKuwaitKyrgyz RepublicLao PDRLatin America & Caribbean Latin America & Caribbean (excluding high income)Latin America & the Caribbean (IDA & IBRD countries)LatviaLeast developed countries: UN classificationLebanonLesothoLiberiaLithuaniaLow incomeLower middle incomeLuxembourgMacedonia, FYRMadagascarMalawiMalaysiaMaldivesMarshall IslandsMauritaniaMauritiusMexicoMicronesia, Fed. Sts.Middle East & North AfricaMiddle East & North Africa (excluding high income)Middle East & North Africa (IDA & IBRD countries)MoldovaMongoliaMontenegroMoroccoMozambiqueMyanmarNamibiaNepalNetherlandsNew ZealandNicaraguaNigerNigeriaNorth AmericaNorwayOECD membersOmanOther small statesPacific island small statesPakistanPalauPanamaPapua New GuineaParaguayPeruPhilippinesPolandPortugalPost-demographic dividendPre-demographic dividendPuerto RicoQatarRomaniaRussian FederationRwandaSamoaSao Tome and PrincipeSaudi ArabiaSenegalSerbiaSeychellesSierra LeoneSingaporeSlovak RepublicSloveniaSmall statesSolomon IslandsSomaliaSouth AfricaSouth AsiaSouth Asia (IDA & IBRD)SpainSri LankaSt. Kitts and NevisSt. LuciaSt. Vincent and the GrenadinesSub-Saharan Africa Sub-Saharan Africa (excluding high income)Sub-Saharan Africa (IDA & IBRD countries)SudanSurinameSwazilandSwedenSwitzerlandSyrian Arab RepublicTajikistanTanzaniaThailandTimor-LesteTogoTongaTrinidad and TobagoTunisiaTurkeyTuvaluUgandaUkraineUnited Arab EmiratesUnited KingdomUnited StatesUruguayUzbekistanVanuatuVenezuela, RBVietnamWest Bank and GazaWorldZambiaZimbabwe Timeline:
This timeline shows a graph from 1967 to 2016 of Tunisia. No data until 1966. Number of actual observations by date: 50.
Source name:
World Development Indicators
Source organization:
World Bank national accounts data, and OECD National Accounts data files.
Categories, topics:
Economy & Growth
Last updated:
apr 23, 2017
Indicators value changes by year
Minimum:
-21.854
jan 1, 1991
Maximum:
42.682
jan 1, 1972
At the date of observation
Value
Absolute change
Change from previous value
jan 1, 1967
-0.253
-0.253
0.0%
jan 1, 1968
-1.745
-1.492
589.22%
jan 1, 1969
-3.779
-2.034
116.51%
jan 1, 1970
7.788
+11.567
-306.08%
jan 1, 1971
-5.73
-13.518
-173.58%
jan 1, 1972
42.682
+48.413
-844.86%
jan 1, 1973
32.855
-9.828
-23.02%
jan 1, 1974
5.978
-26.877
-81.81%
jan 1, 1975
15.096
+9.119
152.54%
jan 1, 1976
5.872
-9.224
-61.1%
jan 1, 1977
35.412
+29.539
503.03%
jan 1, 1978
3.259
-32.153
-90.8%
jan 1, 1979
5.868
+2.609
80.07%
jan 1, 1980
11.578
+5.71
97.3%
jan 1, 1981
12.052
+0.474
4.09%
jan 1, 1982
12.987
+0.935
7.76%
jan 1, 1983
2.814
-10.173
-78.33%
jan 1, 1984
5.737
+2.923
103.9%
jan 1, 1985
6.524
+0.787
13.72%
jan 1, 1986
3.884
-2.64
-40.46%
jan 1, 1987
-0.912
-4.796
-123.48%
jan 1, 1988
2.29
+3.202
-351.11%
jan 1, 1989
3.906
+1.616
70.56%
jan 1, 1990
19.056
+15.15
387.86%
jan 1, 1991
-21.854
-40.91
-214.69%
jan 1, 1992
3.887
+25.741
-117.79%
jan 1, 1993
6.461
+2.574
66.21%
jan 1, 1994
4.921
-1.541
-23.84%
jan 1, 1995
8.644
+3.723
75.66%
jan 1, 1996
4.39
-4.253
-49.2%
jan 1, 1997
2.7
-1.691
-38.51%
jan 1, 1998
7.486
+4.786
177.26%
jan 1, 1999
5.986
-1.5
-20.04%
jan 1, 2000
6.988
+1.003
16.75%
jan 1, 2001
5.74
-1.249
-17.87%
jan 1, 2002
6.855
+1.116
19.44%
jan 1, 2003
0.817
-6.038
-88.08%
jan 1, 2004
0.74
-0.078
-9.49%
jan 1, 2005
2.399
+1.659
224.33%
jan 1, 2006
1.306
-1.093
-45.56%
jan 1, 2007
4.066
+2.76
211.34%
jan 1, 2008
8.684
+4.618
113.59%
jan 1, 2009
4.297
-4.387
-50.52%
jan 1, 2010
-0.974
-5.271
-122.67%
jan 1, 2011
7.024
+7.999
-821.16%
jan 1, 2012
-2.713
-9.738
-138.62%
jan 1, 2013
2.048
+4.761
-175.49%
jan 1, 2014
1.543
-0.505
-24.68%
jan 1, 2015
0.896
-0.646
-41.9%
jan 1, 2016
-0.017
-0.914
-101.95%
Ranking of countries by current statistics by years


Comments: