29
/
en
AIzaSyAYiBZKx7MnpbEhh9jyipgxe19OcubqV5w
April 1, 2024
262519
Thailand
THA
true
2
1
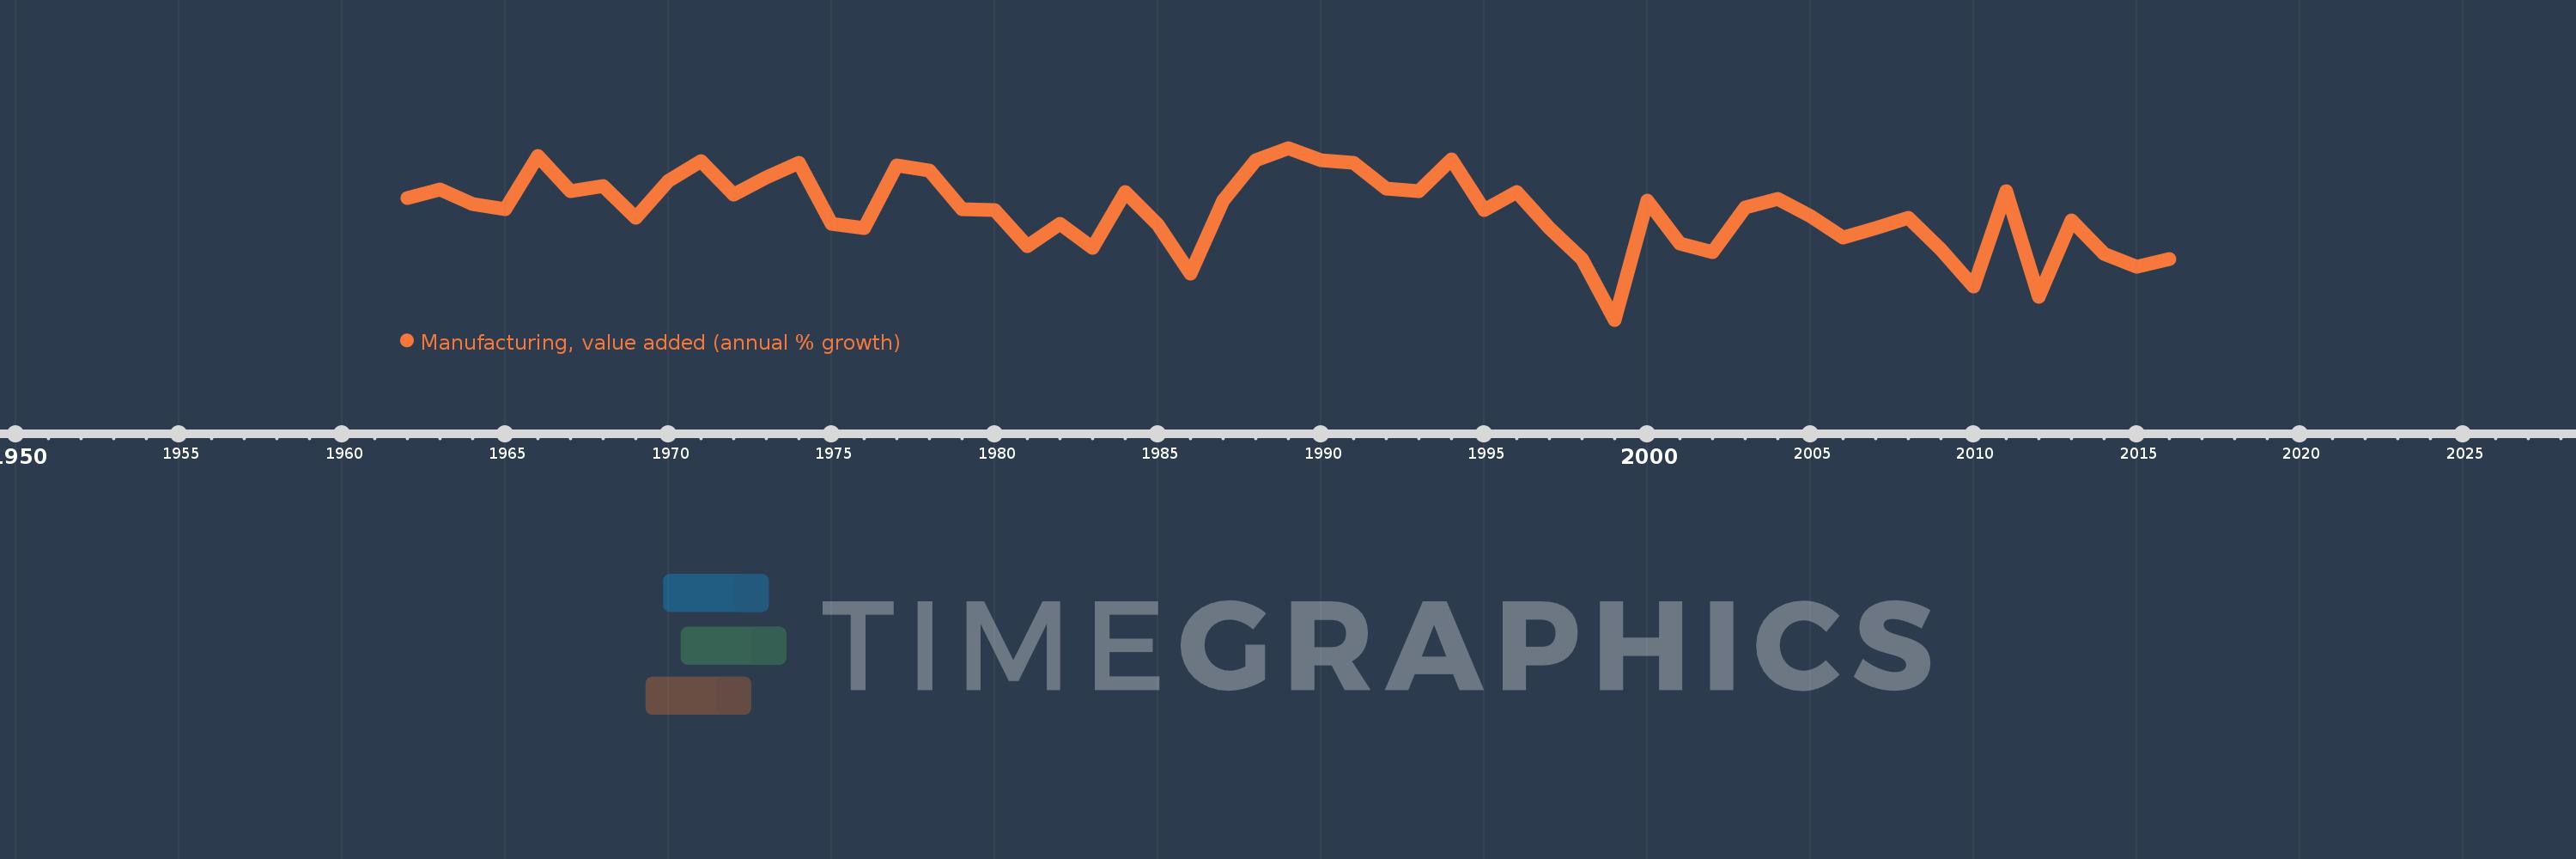
Manufacturing, value added (annual % growth)
2016,2015,2014,2013,2012,2011,2010,2009,2008,2007,2006,2005,2004,2003,2002,2001,2000,1999,1998,1997,1996,1995,1994,1993,1992,1991,1990,1989,1988,1987,1986,1985,1984,1983,1982,1981,1980,1979,1978,1977,1976,1975,1974,1973,1972,1971,1970,1969,1968,1967,1966,1965,1964,1963,1962
This statistics in other country:
AfghanistanAlbaniaAlgeriaAntigua and BarbudaArab WorldArgentinaArmeniaAustraliaAustriaAzerbaijanBahamas, TheBahrainBangladeshBelarusBelgiumBelizeBeninBermudaBhutanBoliviaBosnia and HerzegovinaBotswanaBrazilBrunei DarussalamBurkina FasoBurundiCabo VerdeCambodiaCameroonCanadaCaribbean small statesCayman IslandsCentral African RepublicCentral Europe and the BalticsChadChileColombiaComorosCongo, Dem. Rep.Congo, Rep.Costa RicaCote d'IvoireCroatiaCubaCyprusCzech RepublicDenmarkDjiboutiDominicaDominican RepublicEarly-demographic dividendEcuadorEgypt, Arab Rep.El SalvadorEquatorial GuineaEritreaEstoniaEthiopiaEuro areaEurope & Central AsiaEurope & Central Asia (excluding high income)Europe & Central Asia (IDA & IBRD countries)European UnionFijiFinlandFragile and conflict affected situationsFranceGabonGambia, TheGeorgiaGermanyGhanaGreeceGrenadaGuatemalaGuineaGuyanaHaitiHeavily indebted poor countries (HIPC)High incomeHondurasHong Kong SAR, ChinaHungaryIcelandIDA blendIDA onlyIDA totalIndiaIndonesiaIran, Islamic Rep.IraqIrelandItalyJamaicaJapanJordanKazakhstanKenyaKiribatiKorea, Rep.KosovoKuwaitKyrgyz RepublicLao PDRLatin America & Caribbean Latin America & Caribbean (excluding high income)Latin America & the Caribbean (IDA & IBRD countries)LatviaLeast developed countries: UN classificationLebanonLesothoLiberiaLithuaniaLow incomeLower middle incomeLuxembourgMacedonia, FYRMadagascarMalawiMalaysiaMaldivesMarshall IslandsMauritaniaMauritiusMexicoMicronesia, Fed. Sts.Middle East & North AfricaMiddle East & North Africa (excluding high income)Middle East & North Africa (IDA & IBRD countries)MoldovaMongoliaMontenegroMoroccoMozambiqueMyanmarNamibiaNepalNetherlandsNew ZealandNicaraguaNigerNigeriaNorth AmericaNorwayOECD membersOmanOther small statesPacific island small statesPakistanPalauPanamaPapua New GuineaParaguayPeruPhilippinesPolandPortugalPost-demographic dividendPre-demographic dividendPuerto RicoQatarRomaniaRussian FederationRwandaSamoaSao Tome and PrincipeSaudi ArabiaSenegalSerbiaSeychellesSierra LeoneSingaporeSlovak RepublicSloveniaSmall statesSolomon IslandsSomaliaSouth AfricaSouth AsiaSouth Asia (IDA & IBRD)SpainSri LankaSt. Kitts and NevisSt. LuciaSt. Vincent and the GrenadinesSub-Saharan Africa Sub-Saharan Africa (excluding high income)Sub-Saharan Africa (IDA & IBRD countries)SudanSurinameSwazilandSwedenSwitzerlandSyrian Arab RepublicTajikistanTanzaniaThailandTimor-LesteTogoTongaTrinidad and TobagoTunisiaTurkeyTuvaluUgandaUkraineUnited Arab EmiratesUnited KingdomUnited StatesUruguayUzbekistanVanuatuVenezuela, RBVietnamWest Bank and GazaWorldZambiaZimbabwe Timeline:
This timeline shows a graph from 1962 to 2016 of Thailand. No data until 1961. Number of actual observations by date: 55.
Source name:
World Development Indicators
Source organization:
World Bank national accounts data, and OECD National Accounts data files.
Categories, topics:
Economy & Growth
Last updated:
apr 23, 2017
Indicators value changes by year
Minimum:
-8.382
jan 1, 1999
Maximum:
17.932
jan 1, 1989
At the date of observation
Value
Absolute change
Change from previous value
jan 1, 1962
10.256
+10.256
0.0%
jan 1, 1963
11.627
+1.371
13.36%
jan 1, 1964
9.376
-2.251
-19.36%
jan 1, 1965
8.571
-0.805
-8.58%
jan 1, 1966
16.667
+8.096
94.46%
jan 1, 1967
11.278
-5.388
-32.33%
jan 1, 1968
12.162
+0.883
7.83%
jan 1, 1969
7.229
-4.933
-40.56%
jan 1, 1970
12.921
+5.692
78.73%
jan 1, 1971
15.953
+3.032
23.47%
jan 1, 1972
10.843
-5.11
-32.03%
jan 1, 1973
13.406
+2.563
23.64%
jan 1, 1974
15.654
+2.248
16.77%
jan 1, 1975
6.353
-9.301
-59.41%
jan 1, 1976
5.715
-0.639
-10.05%
jan 1, 1977
15.233
+9.519
166.57%
jan 1, 1978
14.499
-0.734
-4.82%
jan 1, 1979
8.566
-5.932
-40.92%
jan 1, 1980
8.405
-0.162
-1.89%
jan 1, 1981
2.848
-5.556
-66.11%
jan 1, 1982
6.285
+3.437
120.67%
jan 1, 1983
2.649
-3.636
-57.85%
jan 1, 1984
11.189
+8.54
322.41%
jan 1, 1985
6.195
-4.993
-44.63%
jan 1, 1986
-1.369
-7.565
-122.1%
jan 1, 1987
9.841
+11.21
-818.82%
jan 1, 1988
16.036
+6.194
62.94%
jan 1, 1989
17.932
+1.897
11.83%
jan 1, 1990
16.028
-1.904
-10.62%
jan 1, 1991
15.675
-0.353
-2.2%
jan 1, 1992
11.721
-3.953
-25.22%
jan 1, 1993
11.301
-0.42
-3.58%
jan 1, 1994
16.239
+4.937
43.69%
jan 1, 1995
8.375
-7.864
-48.42%
jan 1, 1996
11.176
+2.801
33.44%
jan 1, 1997
5.708
-5.468
-48.93%
jan 1, 1998
0.871
-4.837
-84.73%
jan 1, 1999
-8.382
-9.253
-1.06K%
jan 1, 2000
9.806
+18.188
-216.99%
jan 1, 2001
3.313
-6.493
-66.21%
jan 1, 2002
1.959
-1.354
-40.88%
jan 1, 2003
8.824
+6.865
350.48%
jan 1, 2004
10.156
+1.333
15.1%
jan 1, 2005
7.457
-2.699
-26.58%
jan 1, 2006
4.212
-3.246
-43.52%
jan 1, 2007
5.61
+1.399
33.21%
jan 1, 2008
7.232
+1.621
28.9%
jan 1, 2009
2.388
-4.844
-66.98%
jan 1, 2010
-3.31
-5.698
-238.59%
jan 1, 2011
11.37
+14.68
-443.56%
jan 1, 2012
-4.832
-16.202
-142.5%
jan 1, 2013
6.9
+11.732
-242.79%
jan 1, 2014
1.721
-5.179
-75.06%
jan 1, 2015
-0.24
-1.961
-113.97%
jan 1, 2016
0.928
+1.168
-486.07%
Ranking of countries by current statistics by years


Comments: