29
/
en
AIzaSyAYiBZKx7MnpbEhh9jyipgxe19OcubqV5w
April 1, 2024
265985
Tonga
TON
true
2
1
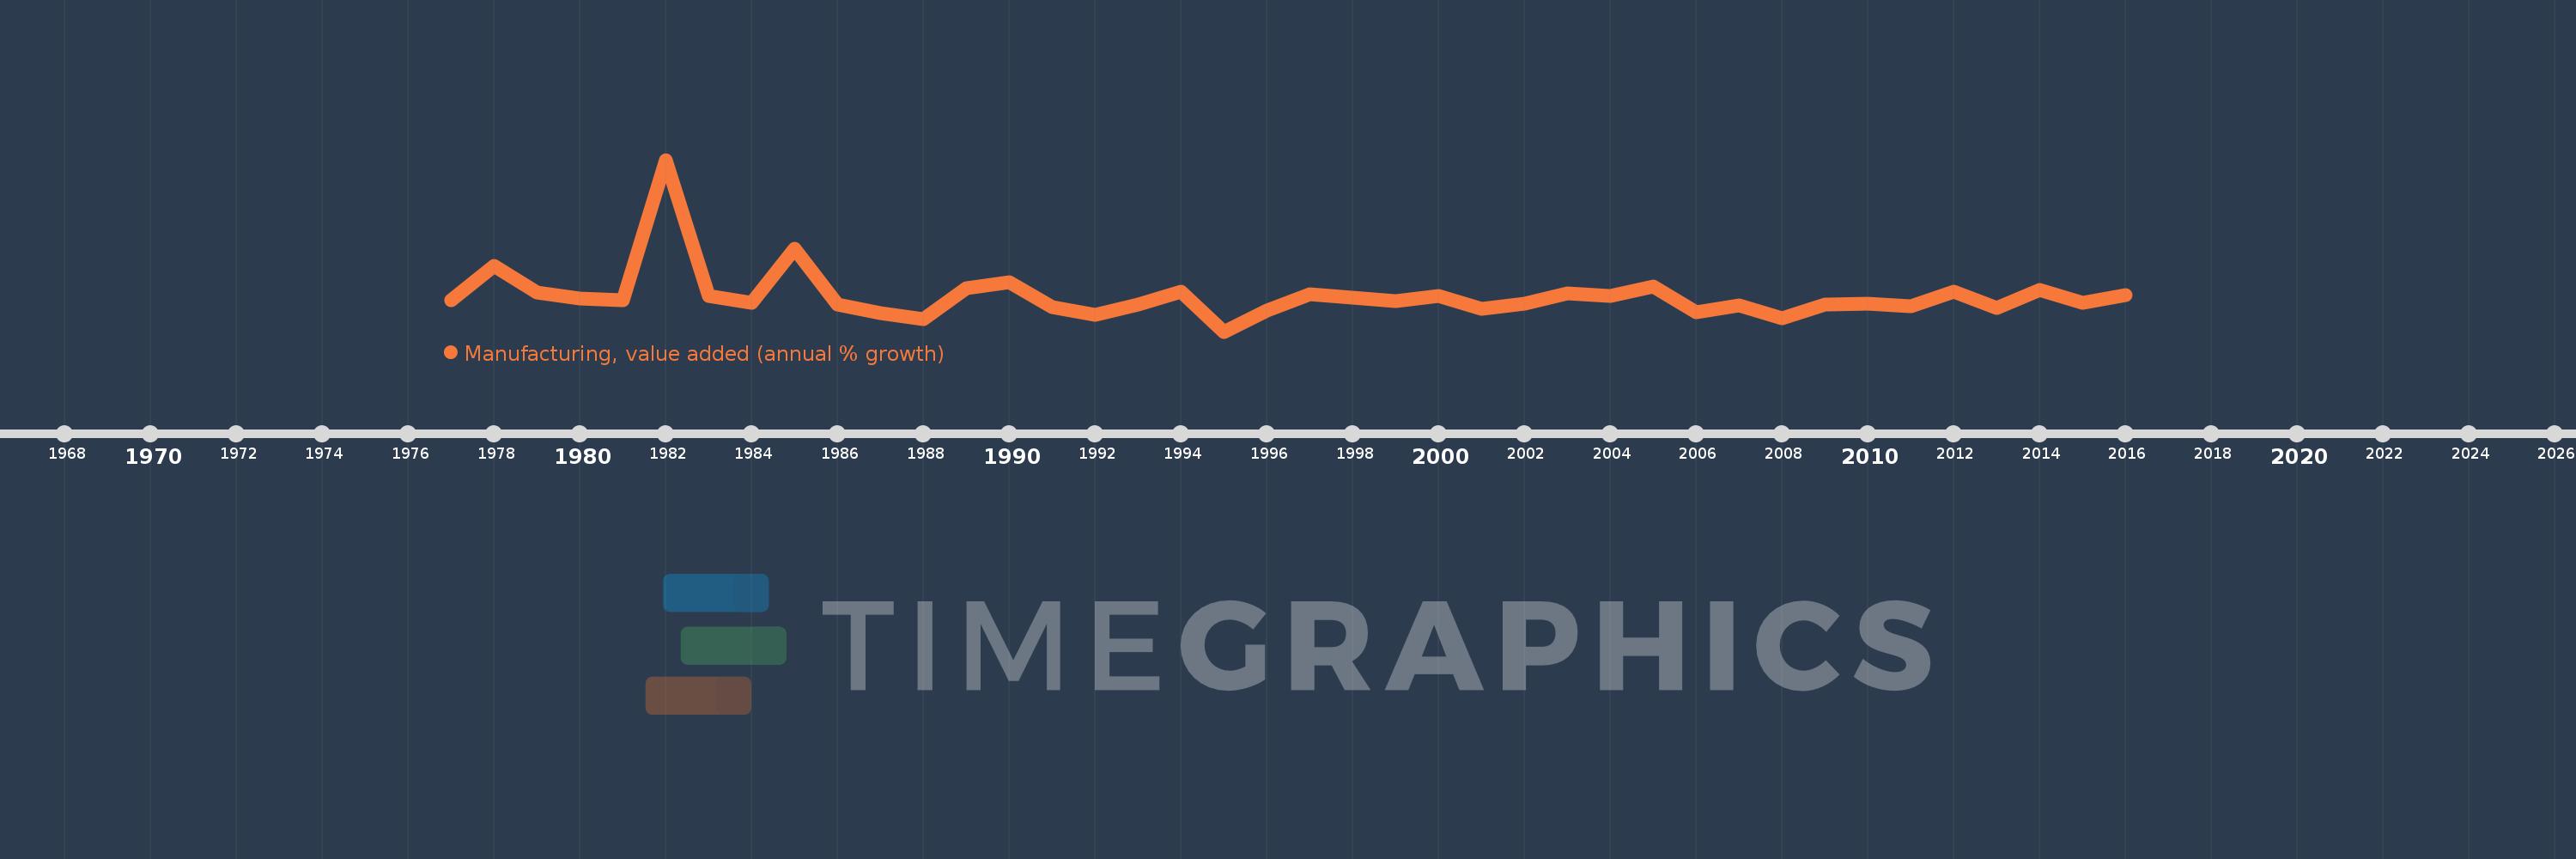
Manufacturing, value added (annual % growth)
2016,2015,2014,2013,2012,2011,2010,2009,2008,2007,2006,2005,2004,2003,2002,2001,2000,1999,1998,1997,1996,1995,1994,1993,1992,1991,1990,1989,1988,1987,1986,1985,1984,1983,1982,1981,1980,1979,1978,1977
This statistics in other country:
AfghanistanAlbaniaAlgeriaAntigua and BarbudaArab WorldArgentinaArmeniaAustraliaAustriaAzerbaijanBahamas, TheBahrainBangladeshBelarusBelgiumBelizeBeninBermudaBhutanBoliviaBosnia and HerzegovinaBotswanaBrazilBrunei DarussalamBurkina FasoBurundiCabo VerdeCambodiaCameroonCanadaCaribbean small statesCayman IslandsCentral African RepublicCentral Europe and the BalticsChadChileColombiaComorosCongo, Dem. Rep.Congo, Rep.Costa RicaCote d'IvoireCroatiaCubaCyprusCzech RepublicDenmarkDjiboutiDominicaDominican RepublicEarly-demographic dividendEcuadorEgypt, Arab Rep.El SalvadorEquatorial GuineaEritreaEstoniaEthiopiaEuro areaEurope & Central AsiaEurope & Central Asia (excluding high income)Europe & Central Asia (IDA & IBRD countries)European UnionFijiFinlandFragile and conflict affected situationsFranceGabonGambia, TheGeorgiaGermanyGhanaGreeceGrenadaGuatemalaGuineaGuyanaHaitiHeavily indebted poor countries (HIPC)High incomeHondurasHong Kong SAR, ChinaHungaryIcelandIDA blendIDA onlyIDA totalIndiaIndonesiaIran, Islamic Rep.IraqIrelandItalyJamaicaJapanJordanKazakhstanKenyaKiribatiKorea, Rep.KosovoKuwaitKyrgyz RepublicLao PDRLatin America & Caribbean Latin America & Caribbean (excluding high income)Latin America & the Caribbean (IDA & IBRD countries)LatviaLeast developed countries: UN classificationLebanonLesothoLiberiaLithuaniaLow incomeLower middle incomeLuxembourgMacedonia, FYRMadagascarMalawiMalaysiaMaldivesMarshall IslandsMauritaniaMauritiusMexicoMicronesia, Fed. Sts.Middle East & North AfricaMiddle East & North Africa (excluding high income)Middle East & North Africa (IDA & IBRD countries)MoldovaMongoliaMontenegroMoroccoMozambiqueMyanmarNamibiaNepalNetherlandsNew ZealandNicaraguaNigerNigeriaNorth AmericaNorwayOECD membersOmanOther small statesPacific island small statesPakistanPalauPanamaPapua New GuineaParaguayPeruPhilippinesPolandPortugalPost-demographic dividendPre-demographic dividendPuerto RicoQatarRomaniaRussian FederationRwandaSamoaSao Tome and PrincipeSaudi ArabiaSenegalSerbiaSeychellesSierra LeoneSingaporeSlovak RepublicSloveniaSmall statesSolomon IslandsSomaliaSouth AfricaSouth AsiaSouth Asia (IDA & IBRD)SpainSri LankaSt. Kitts and NevisSt. LuciaSt. Vincent and the GrenadinesSub-Saharan Africa Sub-Saharan Africa (excluding high income)Sub-Saharan Africa (IDA & IBRD countries)SudanSurinameSwazilandSwedenSwitzerlandSyrian Arab RepublicTajikistanTanzaniaThailandTimor-LesteTogoTongaTrinidad and TobagoTunisiaTurkeyTuvaluUgandaUkraineUnited Arab EmiratesUnited KingdomUnited StatesUruguayUzbekistanVanuatuVenezuela, RBVietnamWest Bank and GazaWorldZambiaZimbabwe Timeline:
This timeline shows a graph from 1977 to 2016 of Tonga. No data until 1976. Number of actual observations by date: 40.
Source name:
World Development Indicators
Source organization:
World Bank national accounts data, and OECD National Accounts data files.
Categories, topics:
Economy & Growth
Last updated:
apr 23, 2017
Indicators value changes by year
Minimum:
-14.859
jan 1, 1995
Maximum:
74.041
jan 1, 1982
At the date of observation
Value
Absolute change
Change from previous value
jan 1, 1977
1.177
+1.177
0.0%
jan 1, 1978
19.259
+18.082
1.54K%
jan 1, 1979
5.424
-13.835
-71.84%
jan 1, 1980
2.37
-3.054
-56.3%
jan 1, 1981
1.581
-0.789
-33.29%
jan 1, 1982
74.041
+72.46
4.58K%
jan 1, 1983
3.418
-70.624
-95.38%
jan 1, 1984
-0.124
-3.541
-103.62%
jan 1, 1985
28.046
+28.169
-22.79K%
jan 1, 1986
-0.652
-28.698
-102.32%
jan 1, 1987
-5.299
-4.647
712.74%
jan 1, 1988
-8.547
-3.248
61.3%
jan 1, 1989
7.746
+16.293
-190.63%
jan 1, 1990
10.498
+2.751
35.52%
jan 1, 1991
-2.075
-12.572
-119.76%
jan 1, 1992
-5.994
-3.92
188.94%
jan 1, 1993
-1.076
+4.919
-82.06%
jan 1, 1994
5.747
+6.822
-634.32%
jan 1, 1995
-14.859
-20.606
-358.57%
jan 1, 1996
-3.895
+10.964
-73.79%
jan 1, 1997
4.299
+8.194
-210.39%
jan 1, 1998
2.747
-1.553
-36.11%
jan 1, 1999
1.069
-1.678
-61.09%
jan 1, 2000
3.762
+2.693
251.92%
jan 1, 2001
-2.963
-6.724
-178.76%
jan 1, 2002
-0.528
+2.435
-82.19%
jan 1, 2003
4.704
+5.232
-991.55%
jan 1, 2004
3.681
-1.023
-21.75%
jan 1, 2005
8.582
+4.901
133.14%
jan 1, 2006
-4.872
-13.454
-156.77%
jan 1, 2007
-1.38
+3.492
-71.68%
jan 1, 2008
-7.84
-6.46
468.23%
jan 1, 2009
-1.022
+6.818
-86.96%
jan 1, 2010
-0.249
+0.773
-75.61%
jan 1, 2011
-1.733
-1.483
594.75%
jan 1, 2012
5.876
+7.608
-439.16%
jan 1, 2013
-2.648
-8.524
-145.06%
jan 1, 2014
6.677
+9.324
-352.17%
jan 1, 2015
0.057
-6.619
-99.14%
jan 1, 2016
4.158
+4.101
7.13K%
Ranking of countries by current statistics by years


Comments: