29
/
en
AIzaSyAYiBZKx7MnpbEhh9jyipgxe19OcubqV5w
April 1, 2024
67665
Angola
AGO
true
2
1
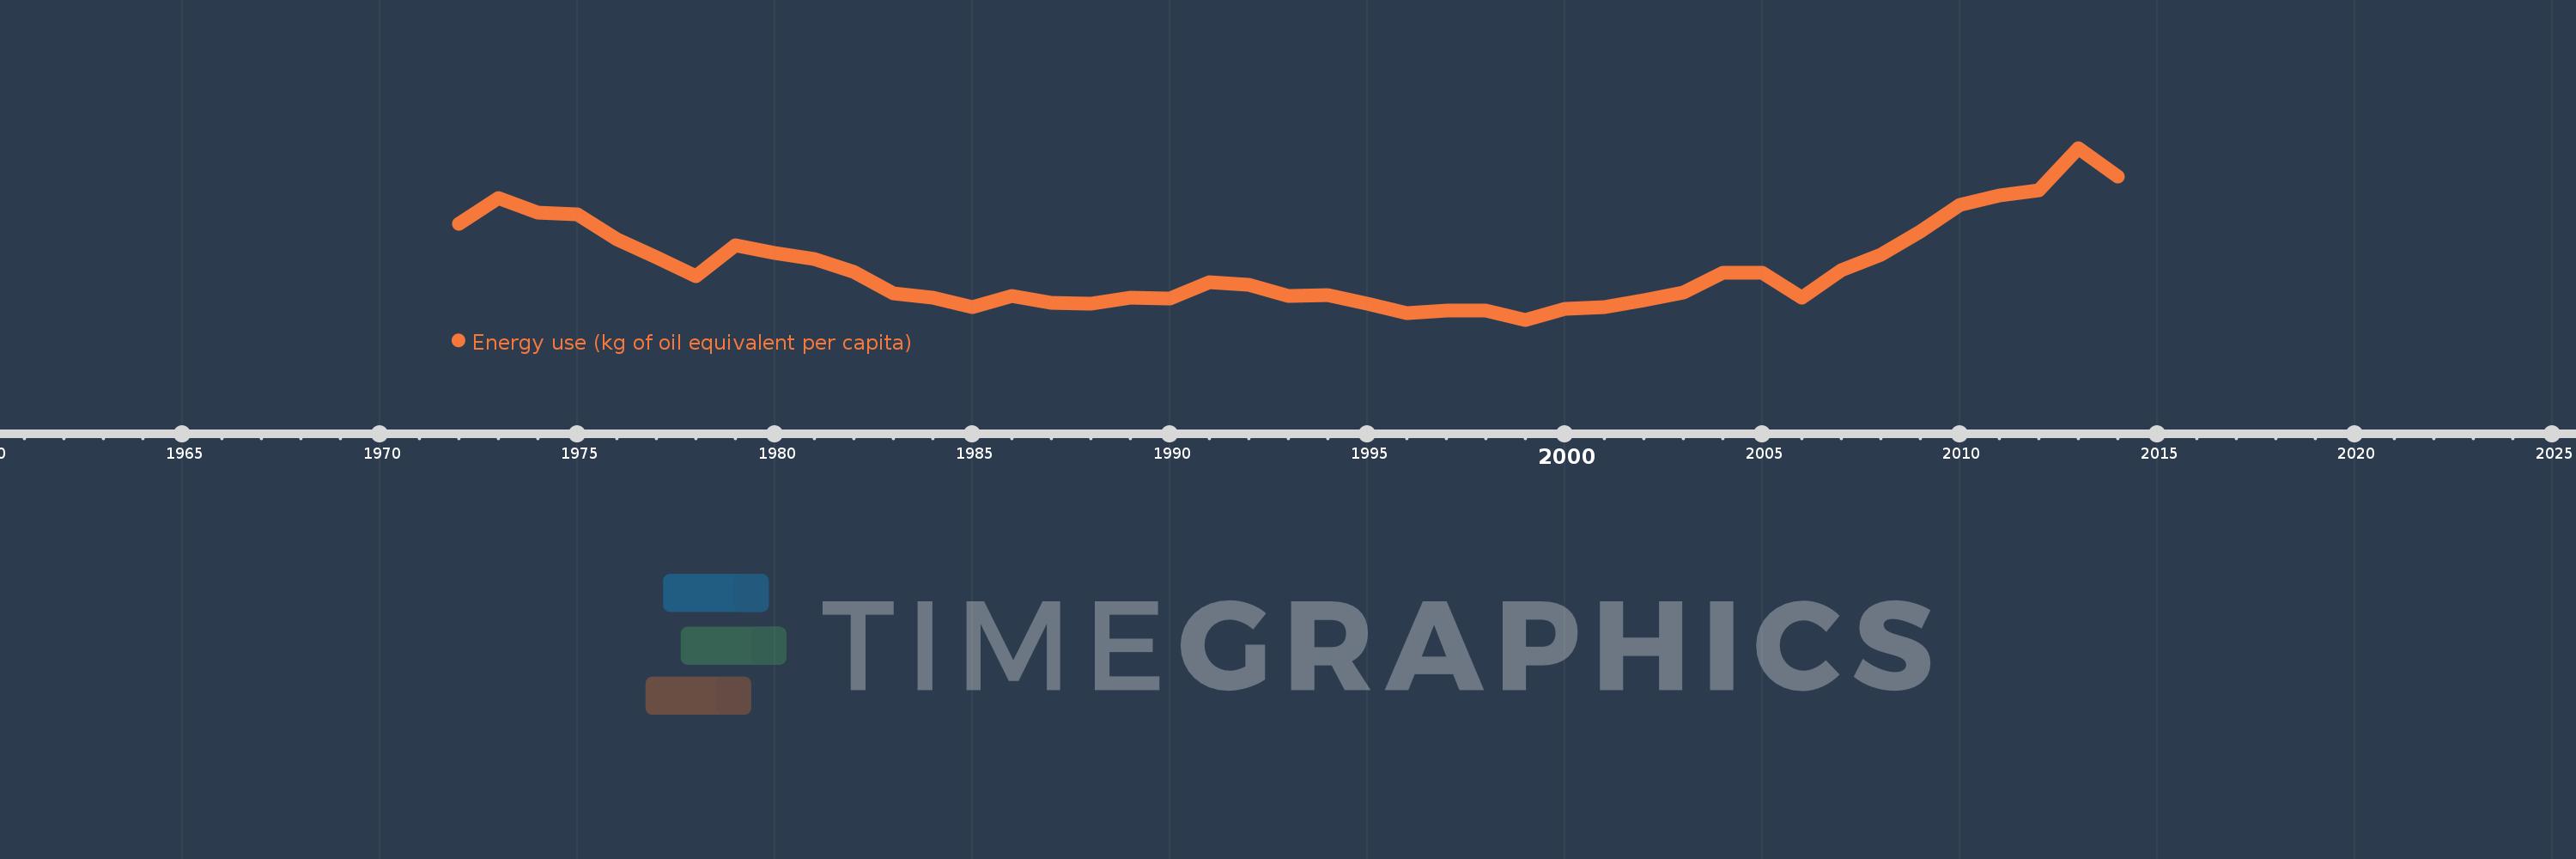
Energy use (kg of oil equivalent per capita)
2014,2013,2012,2011,2010,2009,2008,2007,2006,2005,2004,2003,2002,2001,2000,1999,1998,1997,1996,1995,1994,1993,1992,1991,1990,1989,1988,1987,1986,1985,1984,1983,1982,1981,1980,1979,1978,1977,1976,1975,1974,1973,1972
This statistics in other country:
AlbaniaAlgeriaAngolaAntigua and BarbudaArab WorldArgentinaArmeniaAustraliaAustriaAzerbaijanBahamas, TheBahrainBangladeshBarbadosBelarusBelgiumBelizeBeninBhutanBoliviaBosnia and HerzegovinaBotswanaBrazilBrunei DarussalamBulgariaCabo VerdeCambodiaCameroonCanadaCaribbean small statesCentral Europe and the BalticsChileChinaColombiaComorosCongo, Dem. Rep.Congo, Rep.Costa RicaCote d'IvoireCroatiaCubaCuracaoCyprusCzech RepublicDenmarkDjiboutiDominicaDominican RepublicEarly-demographic dividendEast Asia & PacificEast Asia & Pacific (excluding high income)East Asia & Pacific (IDA & IBRD countries)EcuadorEgypt, Arab Rep.El SalvadorEquatorial GuineaEritreaEstoniaEthiopiaEuro areaEurope & Central AsiaEurope & Central Asia (excluding high income)Europe & Central Asia (IDA & IBRD countries)European UnionFijiFinlandFragile and conflict affected situationsFranceGabonGambia, TheGeorgiaGermanyGhanaGibraltarGreeceGrenadaGuatemalaGuinea-BissauGuyanaHaitiHeavily indebted poor countries (HIPC)High incomeHondurasHong Kong SAR, ChinaHungaryIBRD onlyIcelandIDA & IBRD totalIDA blendIDA onlyIDA totalIndiaIndonesiaIran, Islamic Rep.IraqIrelandIsraelItalyJamaicaJapanJordanKazakhstanKenyaKiribatiKorea, Dem. People’s Rep.Korea, Rep.KosovoKuwaitKyrgyz RepublicLate-demographic dividendLatin America & Caribbean Latin America & Caribbean (excluding high income)Latin America & the Caribbean (IDA & IBRD countries)LatviaLeast developed countries: UN classificationLebanonLesothoLibyaLithuaniaLow & middle incomeLower middle incomeLuxembourgMacedonia, FYRMalaysiaMaldivesMaltaMarshall IslandsMauritiusMexicoMiddle East & North AfricaMiddle East & North Africa (excluding high income)Middle East & North Africa (IDA & IBRD countries)Middle incomeMoldovaMongoliaMontenegroMoroccoMozambiqueMyanmarNamibiaNepalNetherlandsNew ZealandNicaraguaNigerNigeriaNorth AmericaNorwayOECD membersOmanOther small statesPacific island small statesPakistanPalauPanamaParaguayPeruPhilippinesPolandPortugalPost-demographic dividendPre-demographic dividendQatarRomaniaRussian FederationSamoaSao Tome and PrincipeSaudi ArabiaSenegalSerbiaSeychellesSingaporeSlovak RepublicSloveniaSmall statesSolomon IslandsSouth AfricaSouth AsiaSouth Asia (IDA & IBRD)South SudanSpainSri LankaSt. Kitts and NevisSt. LuciaSt. Vincent and the GrenadinesSub-Saharan Africa Sub-Saharan Africa (excluding high income)Sub-Saharan Africa (IDA & IBRD countries)SudanSurinameSwazilandSwedenSwitzerlandSyrian Arab RepublicTajikistanTanzaniaThailandTimor-LesteTogoTongaTrinidad and TobagoTunisiaTurkeyTurkmenistanUkraineUnited Arab EmiratesUnited KingdomUnited StatesUpper middle incomeUruguayUzbekistanVanuatuVenezuela, RBVietnamWorldYemen, Rep.ZambiaZimbabwe Timeline:
This timeline shows a graph from 1972 to 2014 of Angola. No data until 1971. Number of actual observations by date: 43.
Source name:
World Development Indicators
Source organization:
IEA Statistics © OECD/IEA 2014 (http://www.iea.org/stats/index.asp), subject to https://www.iea.org/t&c/termsandconditions/
Categories, topics:
Energy & Mining, Climate Change
Last updated:
apr 23, 2017
Indicators value changes by year
Minimum:
483.203
jan 1, 1999
Maximum:
689.051
jan 1, 2013
At the date of observation
Value
Absolute change
Change from previous value
jan 1, 1972
598.161
+598.161
0.0%
jan 1, 1973
629.302
+31.141
5.21%
jan 1, 1974
611.934
-17.368
-2.76%
jan 1, 1975
609.475
-2.46
-0.4%
jan 1, 1976
579.812
-29.663
-4.87%
jan 1, 1977
557.922
-21.89
-3.78%
jan 1, 1978
535.252
-22.669
-4.06%
jan 1, 1979
572.357
+37.104
6.93%
jan 1, 1980
563.096
-9.261
-1.62%
jan 1, 1981
555.661
-7.435
-1.32%
jan 1, 1982
540.503
-15.158
-2.73%
jan 1, 1983
514.416
-26.087
-4.83%
jan 1, 1984
510.121
-4.295
-0.83%
jan 1, 1985
498.126
-11.995
-2.35%
jan 1, 1986
512.068
+13.942
2.8%
jan 1, 1987
503.575
-8.493
-1.66%
jan 1, 1988
502.598
-0.977
-0.19%
jan 1, 1989
510.151
+7.552
1.5%
jan 1, 1990
508.213
-1.937
-0.38%
jan 1, 1991
528.687
+20.473
4.03%
jan 1, 1992
525.1
-3.586
-0.68%
jan 1, 1993
511.237
-13.863
-2.64%
jan 1, 1994
512.271
+1.034
0.2%
jan 1, 1995
502.783
-9.488
-1.85%
jan 1, 1996
490.614
-12.168
-2.42%
jan 1, 1997
493.841
+3.227
0.66%
jan 1, 1998
494.174
+0.333
0.07%
jan 1, 1999
483.203
-10.972
-2.22%
jan 1, 2000
496.302
+13.099
2.71%
jan 1, 2001
497.963
+1.661
0.33%
jan 1, 2002
506.478
+8.515
1.71%
jan 1, 2003
515.403
+8.925
1.76%
jan 1, 2004
539.446
+24.043
4.66%
jan 1, 2005
539.759
+0.313
0.06%
jan 1, 2006
509.923
-29.835
-5.53%
jan 1, 2007
542.109
+32.185
6.31%
jan 1, 2008
561.55
+19.441
3.59%
jan 1, 2009
589.42
+27.87
4.96%
jan 1, 2010
620.639
+31.219
5.3%
jan 1, 2011
632.248
+11.609
1.87%
jan 1, 2012
638.642
+6.394
1.01%
jan 1, 2013
689.051
+50.409
7.89%
jan 1, 2014
654.905
-34.145
-4.96%
Ranking of countries by current statistics by years


Comments: