29
/
en
AIzaSyAYiBZKx7MnpbEhh9jyipgxe19OcubqV5w
April 1, 2024
64619
Albania
ALB
true
2
1
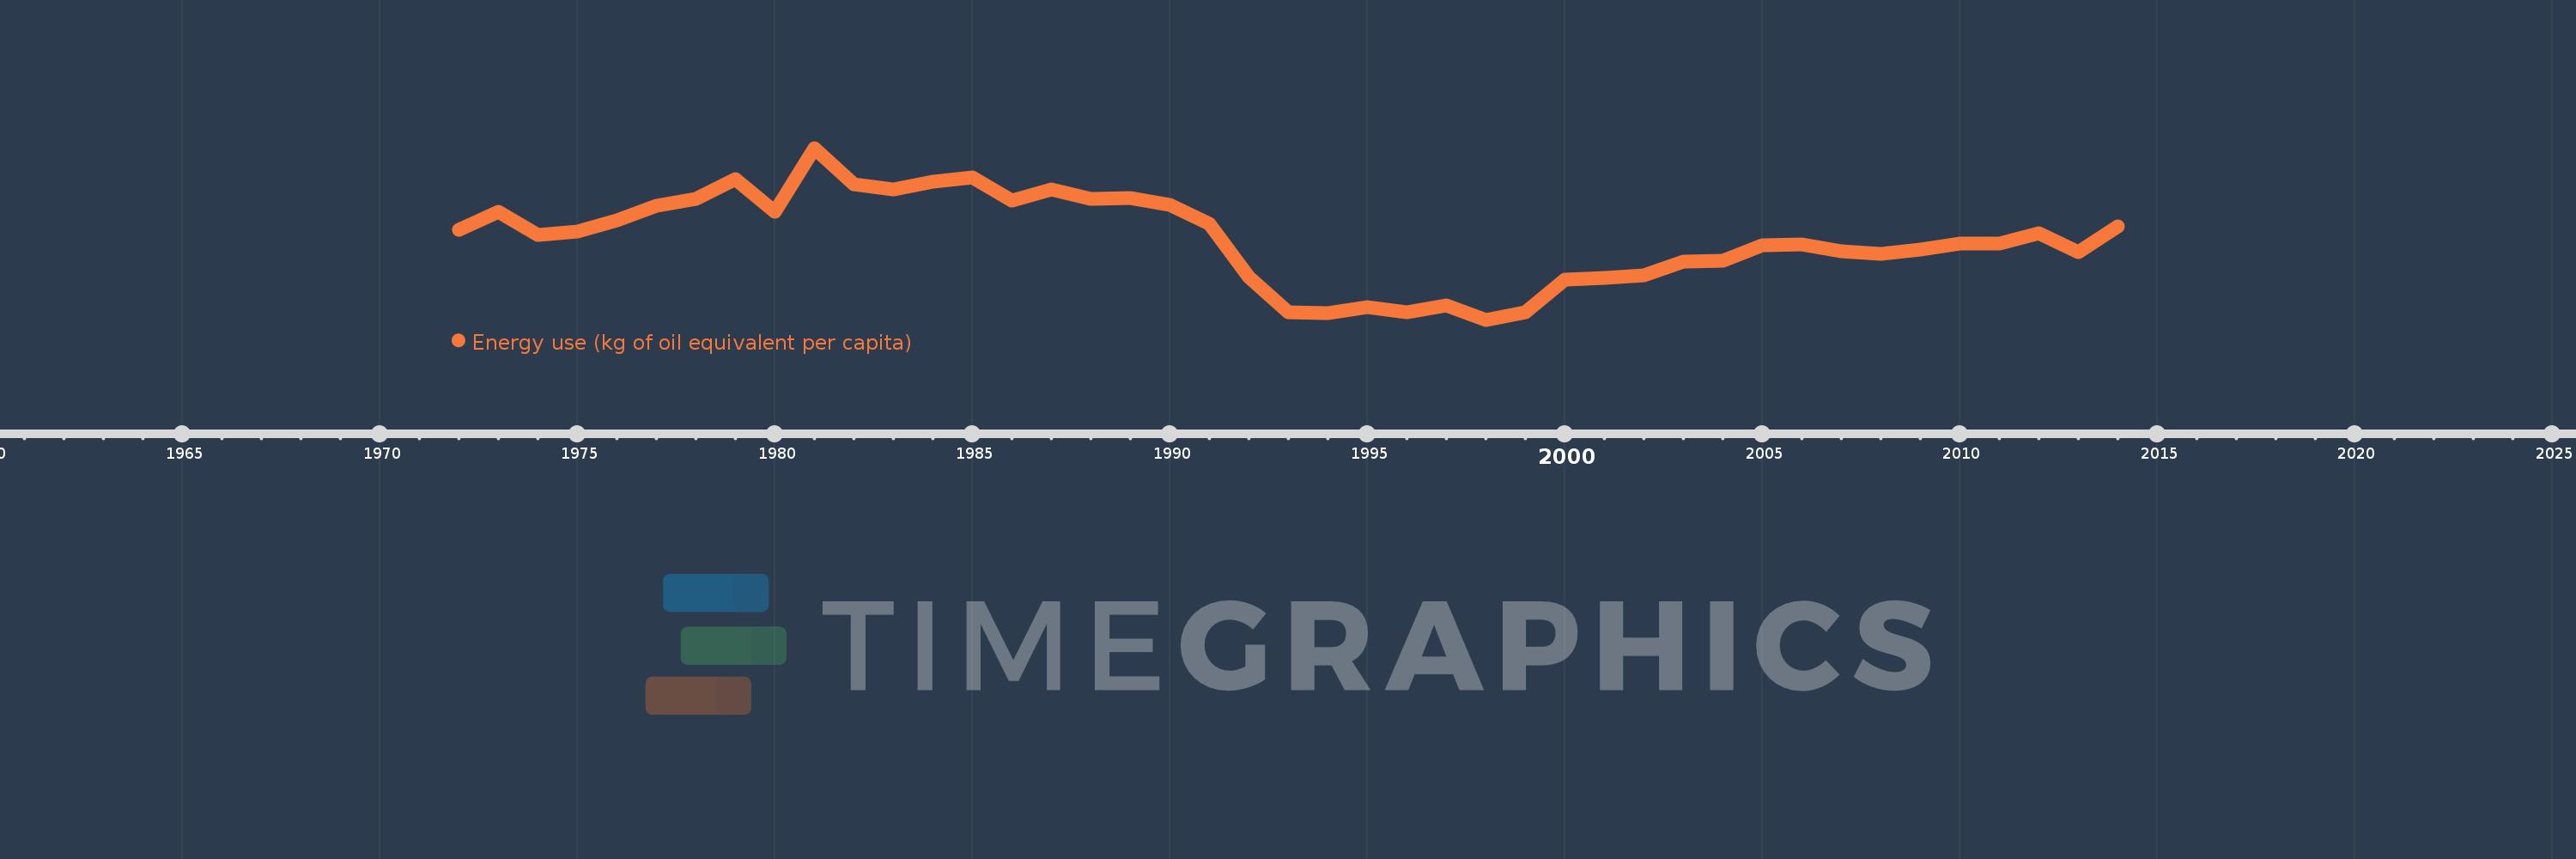
Energy use (kg of oil equivalent per capita)
2014,2013,2012,2011,2010,2009,2008,2007,2006,2005,2004,2003,2002,2001,2000,1999,1998,1997,1996,1995,1994,1993,1992,1991,1990,1989,1988,1987,1986,1985,1984,1983,1982,1981,1980,1979,1978,1977,1976,1975,1974,1973,1972
This statistics in other country:
AlbaniaAlgeriaAngolaAntigua and BarbudaArab WorldArgentinaArmeniaAustraliaAustriaAzerbaijanBahamas, TheBahrainBangladeshBarbadosBelarusBelgiumBelizeBeninBhutanBoliviaBosnia and HerzegovinaBotswanaBrazilBrunei DarussalamBulgariaCabo VerdeCambodiaCameroonCanadaCaribbean small statesCentral Europe and the BalticsChileChinaColombiaComorosCongo, Dem. Rep.Congo, Rep.Costa RicaCote d'IvoireCroatiaCubaCuracaoCyprusCzech RepublicDenmarkDjiboutiDominicaDominican RepublicEarly-demographic dividendEast Asia & PacificEast Asia & Pacific (excluding high income)East Asia & Pacific (IDA & IBRD countries)EcuadorEgypt, Arab Rep.El SalvadorEquatorial GuineaEritreaEstoniaEthiopiaEuro areaEurope & Central AsiaEurope & Central Asia (excluding high income)Europe & Central Asia (IDA & IBRD countries)European UnionFijiFinlandFragile and conflict affected situationsFranceGabonGambia, TheGeorgiaGermanyGhanaGibraltarGreeceGrenadaGuatemalaGuinea-BissauGuyanaHaitiHeavily indebted poor countries (HIPC)High incomeHondurasHong Kong SAR, ChinaHungaryIBRD onlyIcelandIDA & IBRD totalIDA blendIDA onlyIDA totalIndiaIndonesiaIran, Islamic Rep.IraqIrelandIsraelItalyJamaicaJapanJordanKazakhstanKenyaKiribatiKorea, Dem. People’s Rep.Korea, Rep.KosovoKuwaitKyrgyz RepublicLate-demographic dividendLatin America & Caribbean Latin America & Caribbean (excluding high income)Latin America & the Caribbean (IDA & IBRD countries)LatviaLeast developed countries: UN classificationLebanonLesothoLibyaLithuaniaLow & middle incomeLower middle incomeLuxembourgMacedonia, FYRMalaysiaMaldivesMaltaMarshall IslandsMauritiusMexicoMiddle East & North AfricaMiddle East & North Africa (excluding high income)Middle East & North Africa (IDA & IBRD countries)Middle incomeMoldovaMongoliaMontenegroMoroccoMozambiqueMyanmarNamibiaNepalNetherlandsNew ZealandNicaraguaNigerNigeriaNorth AmericaNorwayOECD membersOmanOther small statesPacific island small statesPakistanPalauPanamaParaguayPeruPhilippinesPolandPortugalPost-demographic dividendPre-demographic dividendQatarRomaniaRussian FederationSamoaSao Tome and PrincipeSaudi ArabiaSenegalSerbiaSeychellesSingaporeSlovak RepublicSloveniaSmall statesSolomon IslandsSouth AfricaSouth AsiaSouth Asia (IDA & IBRD)South SudanSpainSri LankaSt. Kitts and NevisSt. LuciaSt. Vincent and the GrenadinesSub-Saharan Africa Sub-Saharan Africa (excluding high income)Sub-Saharan Africa (IDA & IBRD countries)SudanSurinameSwazilandSwedenSwitzerlandSyrian Arab RepublicTajikistanTanzaniaThailandTimor-LesteTogoTongaTrinidad and TobagoTunisiaTurkeyTurkmenistanUkraineUnited Arab EmiratesUnited KingdomUnited StatesUpper middle incomeUruguayUzbekistanVanuatuVenezuela, RBVietnamWorldYemen, Rep.ZambiaZimbabwe Timeline:
This timeline shows a graph from 1972 to 2014 of Albania. No data until 1971. Number of actual observations by date: 43.
Source name:
World Development Indicators
Source organization:
IEA Statistics © OECD/IEA 2014 (http://www.iea.org/stats/index.asp), subject to https://www.iea.org/t&c/termsandconditions/
Categories, topics:
Energy & Mining, Climate Change
Last updated:
apr 23, 2017
Indicators value changes by year
Minimum:
384.595
jan 1, 1998
At the date of observation
Value
Absolute change
Change from previous value
jan 1, 1972
785.162
+785.162
0.0%
jan 1, 1973
865.592
+80.431
10.24%
jan 1, 1974
762.725
-102.867
-11.88%
jan 1, 1975
776.935
+14.209
1.86%
jan 1, 1976
826.952
+50.017
6.44%
jan 1, 1977
890.953
+64.001
7.74%
jan 1, 1978
923.729
+32.776
3.68%
jan 1, 1979
1.011K
+87.09
9.43%
jan 1, 1980
864.199
-146.62
-14.51%
jan 1, 1981
1.15K
+285.337
33.02%
jan 1, 1982
989.2
-160.336
-13.95%
jan 1, 1983
966.683
-22.517
-2.28%
jan 1, 1984
1.0K
+33.439
3.46%
jan 1, 1985
1.018K
+18.141
1.81%
jan 1, 1986
916.555
-101.708
-9.99%
jan 1, 1987
963.927
+47.372
5.17%
jan 1, 1988
921.893
-42.034
-4.36%
jan 1, 1989
927.745
+5.851
0.63%
jan 1, 1990
896.438
-31.307
-3.37%
jan 1, 1991
813.256
-83.182
-9.28%
jan 1, 1992
572.782
-240.474
-29.57%
jan 1, 1993
418.287
-154.495
-26.97%
jan 1, 1994
412.379
-5.908
-1.41%
jan 1, 1995
441.249
+28.87
7.0%
jan 1, 1996
417.035
-24.214
-5.49%
jan 1, 1997
447.849
+30.814
7.39%
jan 1, 1998
384.595
-63.254
-14.12%
jan 1, 1999
417.521
+32.926
8.56%
jan 1, 2000
561.801
+144.28
34.56%
jan 1, 2001
570.845
+9.044
1.61%
jan 1, 2002
582.592
+11.746
2.06%
jan 1, 2003
645.08
+62.489
10.73%
jan 1, 2004
648.168
+3.088
0.48%
jan 1, 2005
715.414
+67.246
10.37%
jan 1, 2006
719.584
+4.17
0.58%
jan 1, 2007
689.3
-30.284
-4.21%
jan 1, 2008
679.862
-9.439
-1.37%
jan 1, 2009
697.004
+17.142
2.52%
jan 1, 2010
722.584
+25.58
3.67%
jan 1, 2011
724.563
+1.979
0.27%
jan 1, 2012
770.34
+45.777
6.32%
jan 1, 2013
685.956
-84.384
-10.95%
jan 1, 2014
800.569
+114.612
16.71%
Ranking of countries by current statistics by years


Comments: