29
/
en
AIzaSyAYiBZKx7MnpbEhh9jyipgxe19OcubqV5w
April 1, 2024
113494
Cote d'Ivoire
CIV
true
2
1
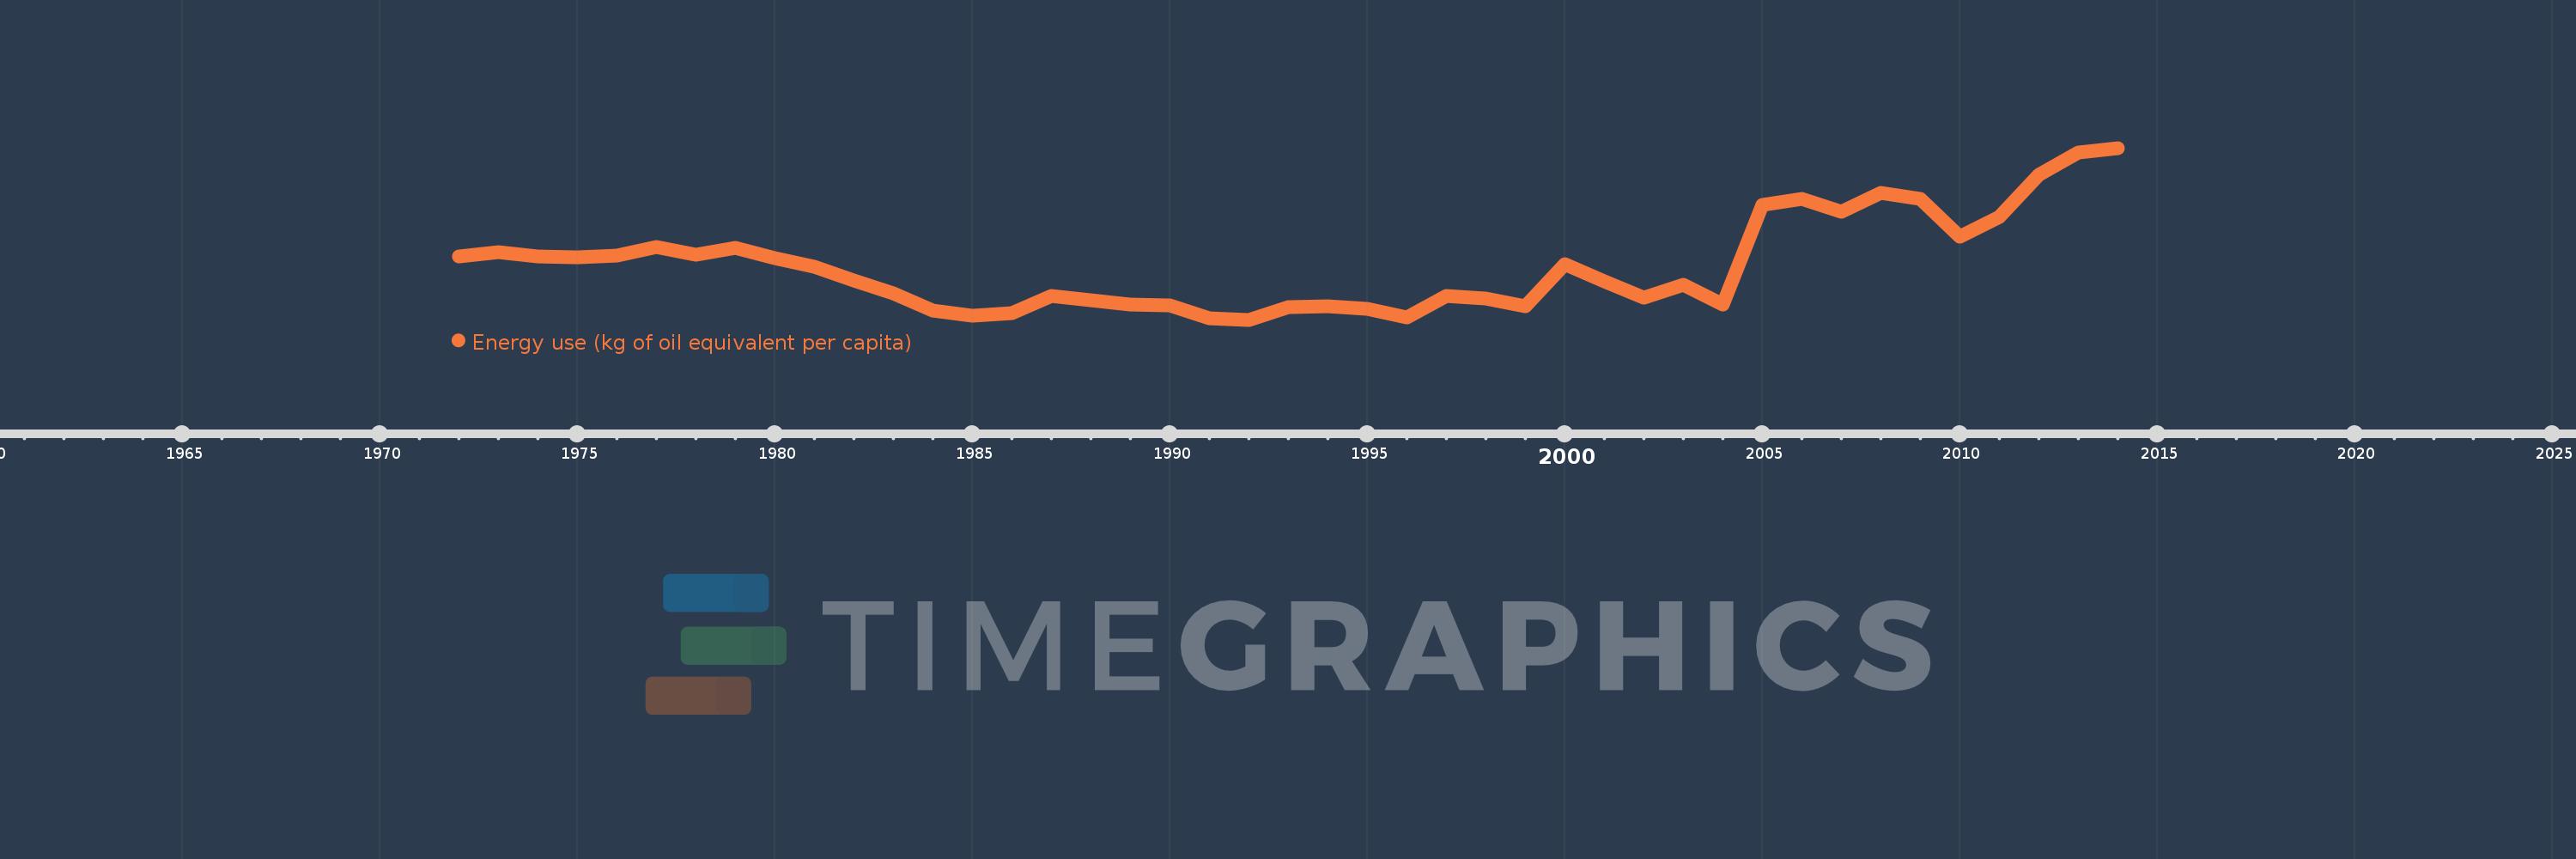
Energy use (kg of oil equivalent per capita)
2014,2013,2012,2011,2010,2009,2008,2007,2006,2005,2004,2003,2002,2001,2000,1999,1998,1997,1996,1995,1994,1993,1992,1991,1990,1989,1988,1987,1986,1985,1984,1983,1982,1981,1980,1979,1978,1977,1976,1975,1974,1973,1972
This statistics in other country:
AlbaniaAlgeriaAngolaAntigua and BarbudaArab WorldArgentinaArmeniaAustraliaAustriaAzerbaijanBahamas, TheBahrainBangladeshBarbadosBelarusBelgiumBelizeBeninBhutanBoliviaBosnia and HerzegovinaBotswanaBrazilBrunei DarussalamBulgariaCabo VerdeCambodiaCameroonCanadaCaribbean small statesCentral Europe and the BalticsChileChinaColombiaComorosCongo, Dem. Rep.Congo, Rep.Costa RicaCote d'IvoireCroatiaCubaCuracaoCyprusCzech RepublicDenmarkDjiboutiDominicaDominican RepublicEarly-demographic dividendEast Asia & PacificEast Asia & Pacific (excluding high income)East Asia & Pacific (IDA & IBRD countries)EcuadorEgypt, Arab Rep.El SalvadorEquatorial GuineaEritreaEstoniaEthiopiaEuro areaEurope & Central AsiaEurope & Central Asia (excluding high income)Europe & Central Asia (IDA & IBRD countries)European UnionFijiFinlandFragile and conflict affected situationsFranceGabonGambia, TheGeorgiaGermanyGhanaGibraltarGreeceGrenadaGuatemalaGuinea-BissauGuyanaHaitiHeavily indebted poor countries (HIPC)High incomeHondurasHong Kong SAR, ChinaHungaryIBRD onlyIcelandIDA & IBRD totalIDA blendIDA onlyIDA totalIndiaIndonesiaIran, Islamic Rep.IraqIrelandIsraelItalyJamaicaJapanJordanKazakhstanKenyaKiribatiKorea, Dem. People’s Rep.Korea, Rep.KosovoKuwaitKyrgyz RepublicLate-demographic dividendLatin America & Caribbean Latin America & Caribbean (excluding high income)Latin America & the Caribbean (IDA & IBRD countries)LatviaLeast developed countries: UN classificationLebanonLesothoLibyaLithuaniaLow & middle incomeLower middle incomeLuxembourgMacedonia, FYRMalaysiaMaldivesMaltaMarshall IslandsMauritiusMexicoMiddle East & North AfricaMiddle East & North Africa (excluding high income)Middle East & North Africa (IDA & IBRD countries)Middle incomeMoldovaMongoliaMontenegroMoroccoMozambiqueMyanmarNamibiaNepalNetherlandsNew ZealandNicaraguaNigerNigeriaNorth AmericaNorwayOECD membersOmanOther small statesPacific island small statesPakistanPalauPanamaParaguayPeruPhilippinesPolandPortugalPost-demographic dividendPre-demographic dividendQatarRomaniaRussian FederationSamoaSao Tome and PrincipeSaudi ArabiaSenegalSerbiaSeychellesSingaporeSlovak RepublicSloveniaSmall statesSolomon IslandsSouth AfricaSouth AsiaSouth Asia (IDA & IBRD)South SudanSpainSri LankaSt. Kitts and NevisSt. LuciaSt. Vincent and the GrenadinesSub-Saharan Africa Sub-Saharan Africa (excluding high income)Sub-Saharan Africa (IDA & IBRD countries)SudanSurinameSwazilandSwedenSwitzerlandSyrian Arab RepublicTajikistanTanzaniaThailandTimor-LesteTogoTongaTrinidad and TobagoTunisiaTurkeyTurkmenistanUkraineUnited Arab EmiratesUnited KingdomUnited StatesUpper middle incomeUruguayUzbekistanVanuatuVenezuela, RBVietnamWorldYemen, Rep.ZambiaZimbabwe Timeline:
This timeline shows a graph from 1972 to 2014 of Cote d'Ivoire. No data until 1971. Number of actual observations by date: 43.
Source name:
World Development Indicators
Source organization:
IEA Statistics © OECD/IEA 2014 (http://www.iea.org/stats/index.asp), subject to https://www.iea.org/t&c/termsandconditions/
Categories, topics:
Energy & Mining, Climate Change
Last updated:
apr 23, 2017
Indicators value changes by year
Minimum:
354.733
jan 1, 1992
Maximum:
605.286
jan 1, 2014
At the date of observation
Value
Absolute change
Change from previous value
jan 1, 1972
447.358
+447.358
0.0%
jan 1, 1973
453.243
+5.885
1.32%
jan 1, 1974
446.919
-6.324
-1.4%
jan 1, 1975
445.338
-1.581
-0.35%
jan 1, 1976
448.057
+2.719
0.61%
jan 1, 1977
461.359
+13.302
2.97%
jan 1, 1978
449.521
-11.837
-2.57%
jan 1, 1979
459.598
+10.077
2.24%
jan 1, 1980
444.767
-14.831
-3.23%
jan 1, 1981
432.387
-12.38
-2.78%
jan 1, 1982
412.46
-19.928
-4.61%
jan 1, 1983
393.432
-19.027
-4.61%
jan 1, 1984
368.258
-25.174
-6.4%
jan 1, 1985
360.344
-7.915
-2.15%
jan 1, 1986
363.969
+3.625
1.01%
jan 1, 1987
388.959
+24.99
6.87%
jan 1, 1988
383.372
-5.587
-1.44%
jan 1, 1989
376.531
-6.842
-1.78%
jan 1, 1990
376.179
-0.351
-0.09%
jan 1, 1991
357.155
-19.024
-5.06%
jan 1, 1992
354.733
-2.422
-0.68%
jan 1, 1993
373.66
+18.927
5.34%
jan 1, 1994
373.989
+0.329
0.09%
jan 1, 1995
370.752
-3.236
-0.87%
jan 1, 1996
357.807
-12.945
-3.49%
jan 1, 1997
389.787
+31.98
8.94%
jan 1, 1998
386.175
-3.612
-0.93%
jan 1, 1999
374.614
-11.561
-2.99%
jan 1, 2000
435.315
+60.701
16.2%
jan 1, 2001
411.064
-24.251
-5.57%
jan 1, 2002
387.188
-23.876
-5.81%
jan 1, 2003
406.144
+18.956
4.9%
jan 1, 2004
377.232
-28.912
-7.12%
jan 1, 2005
522.343
+145.111
38.47%
jan 1, 2006
530.447
+8.104
1.55%
jan 1, 2007
511.65
-18.797
-3.54%
jan 1, 2008
539.727
+28.078
5.49%
jan 1, 2009
531.227
-8.5
-1.57%
jan 1, 2010
476.35
-54.877
-10.33%
jan 1, 2011
504.817
+28.467
5.98%
jan 1, 2012
565.481
+60.663
12.02%
jan 1, 2013
598.625
+33.144
5.86%
jan 1, 2014
605.286
+6.661
1.11%
Ranking of countries by current statistics by years


Comments: