29
/
en
AIzaSyAYiBZKx7MnpbEhh9jyipgxe19OcubqV5w
April 1, 2024
130374
Ethiopia
ETH
true
2
1
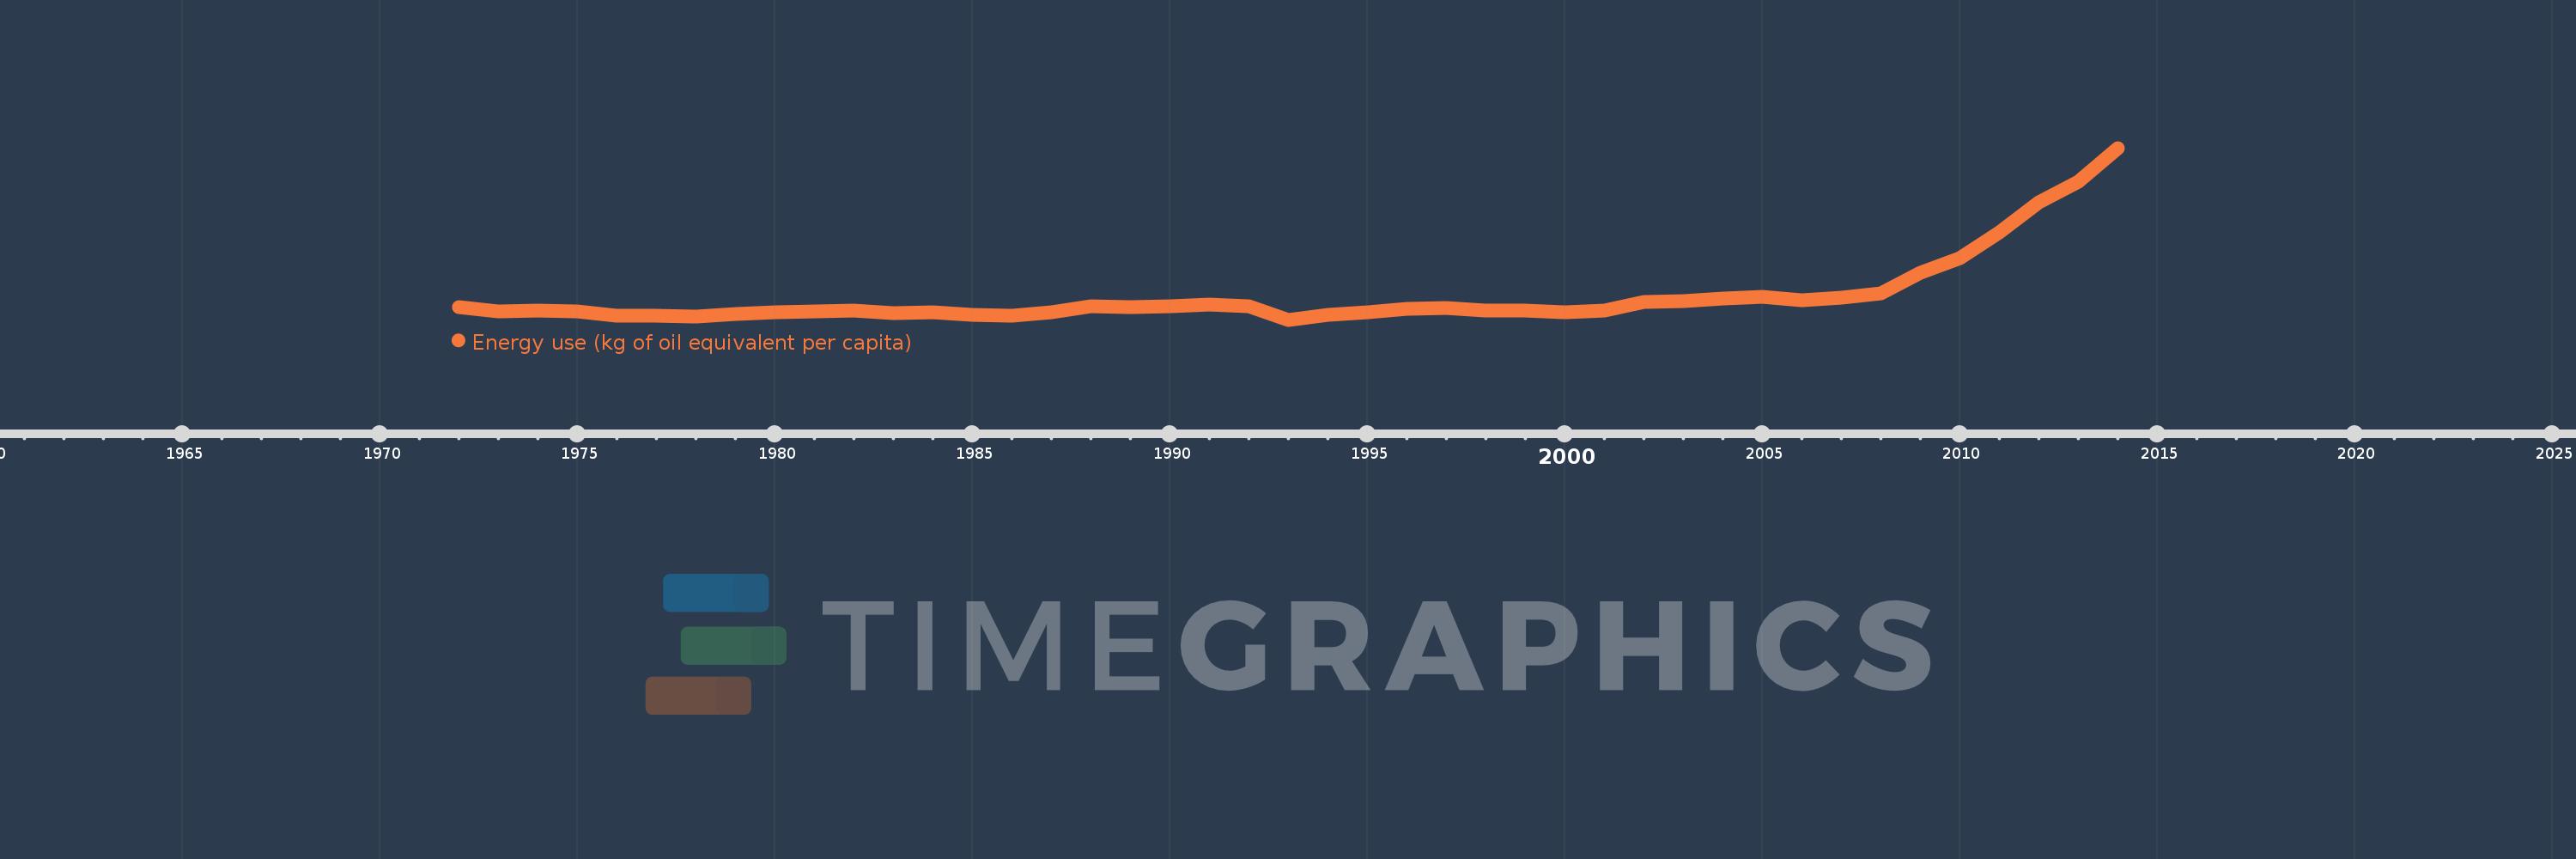
Energy use (kg of oil equivalent per capita)
2014,2013,2012,2011,2010,2009,2008,2007,2006,2005,2004,2003,2002,2001,2000,1999,1998,1997,1996,1995,1994,1993,1992,1991,1990,1989,1988,1987,1986,1985,1984,1983,1982,1981,1980,1979,1978,1977,1976,1975,1974,1973,1972
This statistics in other country:
AlbaniaAlgeriaAngolaAntigua and BarbudaArab WorldArgentinaArmeniaAustraliaAustriaAzerbaijanBahamas, TheBahrainBangladeshBarbadosBelarusBelgiumBelizeBeninBhutanBoliviaBosnia and HerzegovinaBotswanaBrazilBrunei DarussalamBulgariaCabo VerdeCambodiaCameroonCanadaCaribbean small statesCentral Europe and the BalticsChileChinaColombiaComorosCongo, Dem. Rep.Congo, Rep.Costa RicaCote d'IvoireCroatiaCubaCuracaoCyprusCzech RepublicDenmarkDjiboutiDominicaDominican RepublicEarly-demographic dividendEast Asia & PacificEast Asia & Pacific (excluding high income)East Asia & Pacific (IDA & IBRD countries)EcuadorEgypt, Arab Rep.El SalvadorEquatorial GuineaEritreaEstoniaEthiopiaEuro areaEurope & Central AsiaEurope & Central Asia (excluding high income)Europe & Central Asia (IDA & IBRD countries)European UnionFijiFinlandFragile and conflict affected situationsFranceGabonGambia, TheGeorgiaGermanyGhanaGibraltarGreeceGrenadaGuatemalaGuinea-BissauGuyanaHaitiHeavily indebted poor countries (HIPC)High incomeHondurasHong Kong SAR, ChinaHungaryIBRD onlyIcelandIDA & IBRD totalIDA blendIDA onlyIDA totalIndiaIndonesiaIran, Islamic Rep.IraqIrelandIsraelItalyJamaicaJapanJordanKazakhstanKenyaKiribatiKorea, Dem. People’s Rep.Korea, Rep.KosovoKuwaitKyrgyz RepublicLate-demographic dividendLatin America & Caribbean Latin America & Caribbean (excluding high income)Latin America & the Caribbean (IDA & IBRD countries)LatviaLeast developed countries: UN classificationLebanonLesothoLibyaLithuaniaLow & middle incomeLower middle incomeLuxembourgMacedonia, FYRMalaysiaMaldivesMaltaMarshall IslandsMauritiusMexicoMiddle East & North AfricaMiddle East & North Africa (excluding high income)Middle East & North Africa (IDA & IBRD countries)Middle incomeMoldovaMongoliaMontenegroMoroccoMozambiqueMyanmarNamibiaNepalNetherlandsNew ZealandNicaraguaNigerNigeriaNorth AmericaNorwayOECD membersOmanOther small statesPacific island small statesPakistanPalauPanamaParaguayPeruPhilippinesPolandPortugalPost-demographic dividendPre-demographic dividendQatarRomaniaRussian FederationSamoaSao Tome and PrincipeSaudi ArabiaSenegalSerbiaSeychellesSingaporeSlovak RepublicSloveniaSmall statesSolomon IslandsSouth AfricaSouth AsiaSouth Asia (IDA & IBRD)South SudanSpainSri LankaSt. Kitts and NevisSt. LuciaSt. Vincent and the GrenadinesSub-Saharan Africa Sub-Saharan Africa (excluding high income)Sub-Saharan Africa (IDA & IBRD countries)SudanSurinameSwazilandSwedenSwitzerlandSyrian Arab RepublicTajikistanTanzaniaThailandTimor-LesteTogoTongaTrinidad and TobagoTunisiaTurkeyTurkmenistanUkraineUnited Arab EmiratesUnited KingdomUnited StatesUpper middle incomeUruguayUzbekistanVanuatuVenezuela, RBVietnamWorldYemen, Rep.ZambiaZimbabwe Timeline:
This timeline shows a graph from 1972 to 2014 of Ethiopia. No data until 1971. Number of actual observations by date: 43.
Source name:
World Development Indicators
Source organization:
IEA Statistics © OECD/IEA 2014 (http://www.iea.org/stats/index.asp), subject to https://www.iea.org/t&c/termsandconditions/
Categories, topics:
Energy & Mining, Climate Change
Last updated:
apr 23, 2017
Indicators value changes by year
Minimum:
431.152
jan 1, 1993
Maximum:
506.975
jan 1, 2014
At the date of observation
Value
Absolute change
Change from previous value
jan 1, 1972
436.559
+436.559
0.0%
jan 1, 1973
434.793
-1.766
-0.4%
jan 1, 1974
435.245
+0.451
0.1%
jan 1, 1975
434.797
-0.447
-0.1%
jan 1, 1976
432.852
-1.946
-0.45%
jan 1, 1977
432.785
-0.066
-0.02%
jan 1, 1978
432.458
-0.327
-0.08%
jan 1, 1979
433.764
+1.306
0.3%
jan 1, 1980
434.382
+0.617
0.14%
jan 1, 1981
434.719
+0.337
0.08%
jan 1, 1982
435.361
+0.642
0.15%
jan 1, 1983
434.058
-1.302
-0.3%
jan 1, 1984
434.436
+0.378
0.09%
jan 1, 1985
433.142
-1.294
-0.3%
jan 1, 1986
432.997
-0.145
-0.03%
jan 1, 1987
434.619
+1.622
0.37%
jan 1, 1988
437.235
+2.616
0.6%
jan 1, 1989
436.84
-0.395
-0.09%
jan 1, 1990
437.182
+0.342
0.08%
jan 1, 1991
438.006
+0.824
0.19%
jan 1, 1992
437.014
-0.993
-0.23%
jan 1, 1993
431.152
-5.862
-1.34%
jan 1, 1994
433.332
+2.18
0.51%
jan 1, 1995
434.608
+1.276
0.29%
jan 1, 1996
435.8
+1.192
0.27%
jan 1, 1997
436.402
+0.602
0.14%
jan 1, 1998
435.145
-1.256
-0.29%
jan 1, 1999
435.298
+0.153
0.04%
jan 1, 2000
434.51
-0.788
-0.18%
jan 1, 2001
435.179
+0.669
0.15%
jan 1, 2002
438.997
+3.817
0.88%
jan 1, 2003
439.255
+0.258
0.06%
jan 1, 2004
440.651
+1.396
0.32%
jan 1, 2005
441.322
+0.671
0.15%
jan 1, 2006
439.754
-1.568
-0.36%
jan 1, 2007
440.969
+1.216
0.28%
jan 1, 2008
442.867
+1.897
0.43%
jan 1, 2009
451.824
+8.957
2.02%
jan 1, 2010
458.447
+6.623
1.47%
jan 1, 2011
469.658
+11.211
2.45%
jan 1, 2012
483.123
+13.465
2.87%
jan 1, 2013
492.037
+8.913
1.84%
jan 1, 2014
506.975
+14.938
3.04%
Ranking of countries by current statistics by years


Comments: