29
/
en
AIzaSyAYiBZKx7MnpbEhh9jyipgxe19OcubqV5w
April 1, 2024
225824
Portugal
PRT
true
2
1
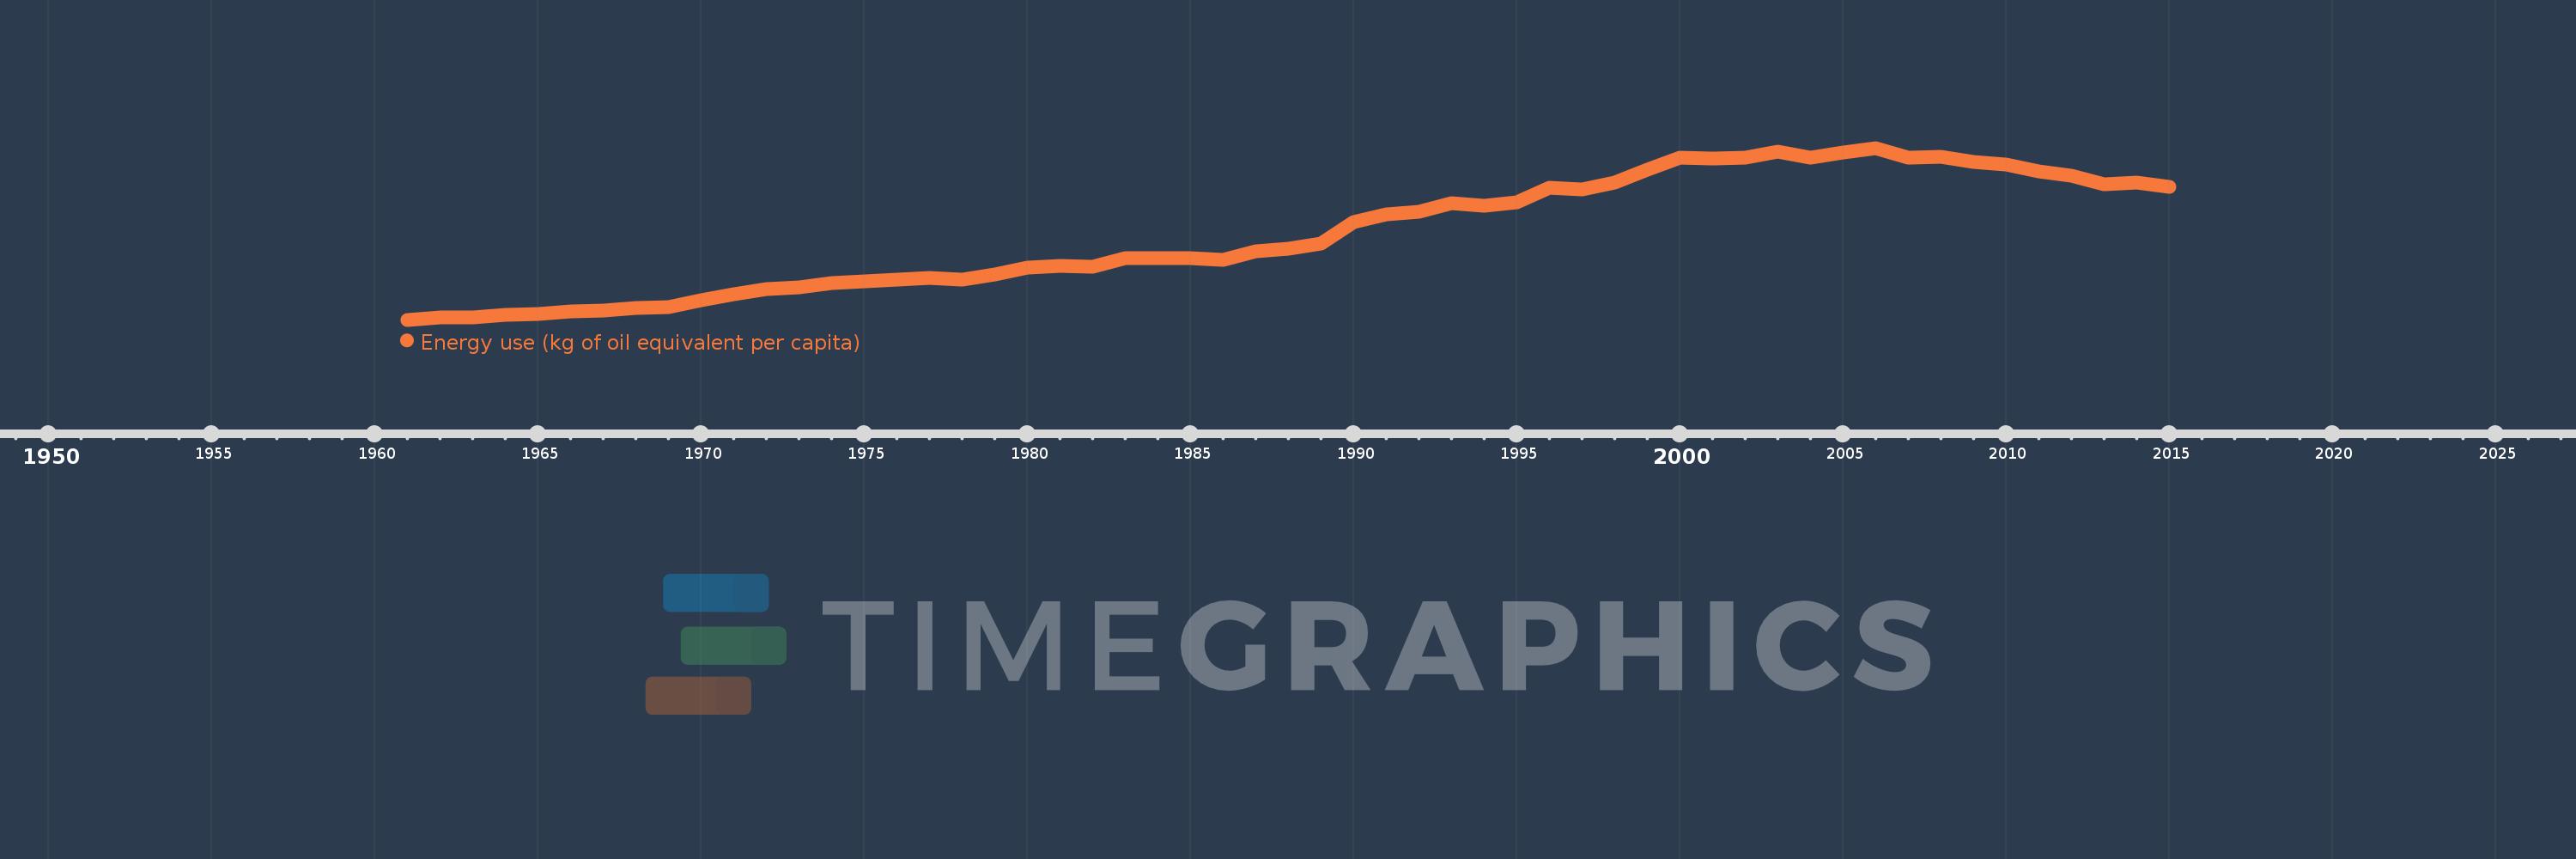
Energy use (kg of oil equivalent per capita)
2015,2014,2013,2012,2011,2010,2009,2008,2007,2006,2005,2004,2003,2002,2001,2000,1999,1998,1997,1996,1995,1994,1993,1992,1991,1990,1989,1988,1987,1986,1985,1984,1983,1982,1981,1980,1979,1978,1977,1976,1975,1974,1973,1972,1971,1970,1969,1968,1967,1966,1965,1964,1963,1962,1961
This statistics in other country:
AlbaniaAlgeriaAngolaAntigua and BarbudaArab WorldArgentinaArmeniaAustraliaAustriaAzerbaijanBahamas, TheBahrainBangladeshBarbadosBelarusBelgiumBelizeBeninBhutanBoliviaBosnia and HerzegovinaBotswanaBrazilBrunei DarussalamBulgariaCabo VerdeCambodiaCameroonCanadaCaribbean small statesCentral Europe and the BalticsChileChinaColombiaComorosCongo, Dem. Rep.Congo, Rep.Costa RicaCote d'IvoireCroatiaCubaCuracaoCyprusCzech RepublicDenmarkDjiboutiDominicaDominican RepublicEarly-demographic dividendEast Asia & PacificEast Asia & Pacific (excluding high income)East Asia & Pacific (IDA & IBRD countries)EcuadorEgypt, Arab Rep.El SalvadorEquatorial GuineaEritreaEstoniaEthiopiaEuro areaEurope & Central AsiaEurope & Central Asia (excluding high income)Europe & Central Asia (IDA & IBRD countries)European UnionFijiFinlandFragile and conflict affected situationsFranceGabonGambia, TheGeorgiaGermanyGhanaGibraltarGreeceGrenadaGuatemalaGuinea-BissauGuyanaHaitiHeavily indebted poor countries (HIPC)High incomeHondurasHong Kong SAR, ChinaHungaryIBRD onlyIcelandIDA & IBRD totalIDA blendIDA onlyIDA totalIndiaIndonesiaIran, Islamic Rep.IraqIrelandIsraelItalyJamaicaJapanJordanKazakhstanKenyaKiribatiKorea, Dem. People’s Rep.Korea, Rep.KosovoKuwaitKyrgyz RepublicLate-demographic dividendLatin America & Caribbean Latin America & Caribbean (excluding high income)Latin America & the Caribbean (IDA & IBRD countries)LatviaLeast developed countries: UN classificationLebanonLesothoLibyaLithuaniaLow & middle incomeLower middle incomeLuxembourgMacedonia, FYRMalaysiaMaldivesMaltaMarshall IslandsMauritiusMexicoMiddle East & North AfricaMiddle East & North Africa (excluding high income)Middle East & North Africa (IDA & IBRD countries)Middle incomeMoldovaMongoliaMontenegroMoroccoMozambiqueMyanmarNamibiaNepalNetherlandsNew ZealandNicaraguaNigerNigeriaNorth AmericaNorwayOECD membersOmanOther small statesPacific island small statesPakistanPalauPanamaParaguayPeruPhilippinesPolandPortugalPost-demographic dividendPre-demographic dividendQatarRomaniaRussian FederationSamoaSao Tome and PrincipeSaudi ArabiaSenegalSerbiaSeychellesSingaporeSlovak RepublicSloveniaSmall statesSolomon IslandsSouth AfricaSouth AsiaSouth Asia (IDA & IBRD)South SudanSpainSri LankaSt. Kitts and NevisSt. LuciaSt. Vincent and the GrenadinesSub-Saharan Africa Sub-Saharan Africa (excluding high income)Sub-Saharan Africa (IDA & IBRD countries)SudanSurinameSwazilandSwedenSwitzerlandSyrian Arab RepublicTajikistanTanzaniaThailandTimor-LesteTogoTongaTrinidad and TobagoTunisiaTurkeyTurkmenistanUkraineUnited Arab EmiratesUnited KingdomUnited StatesUpper middle incomeUruguayUzbekistanVanuatuVenezuela, RBVietnamWorldYemen, Rep.ZambiaZimbabwe Timeline:
This timeline shows a graph from 1961 to 2015 of Portugal. No data until 1960. Number of actual observations by date: 55.
Source name:
World Development Indicators
Source organization:
IEA Statistics © OECD/IEA 2014 (http://www.iea.org/stats/index.asp), subject to https://www.iea.org/t&c/termsandconditions/
Categories, topics:
Energy & Mining, Climate Change
Last updated:
apr 23, 2017
Indicators value changes by year
Minimum:
336.914
jan 1, 1961
Maximum:
2.519K
jan 1, 2006
At the date of observation
Value
Absolute change
Change from previous value
jan 1, 1961
336.914
+336.914
0.0%
jan 1, 1962
365.84
+28.927
8.59%
jan 1, 1963
363.164
-2.676
-0.73%
jan 1, 1964
394.939
+31.775
8.75%
jan 1, 1965
410.252
+15.313
3.88%
jan 1, 1966
440.883
+30.631
7.47%
jan 1, 1967
451.751
+10.868
2.47%
jan 1, 1968
486.585
+34.835
7.71%
jan 1, 1969
497.129
+10.544
2.17%
jan 1, 1970
579.972
+82.843
16.66%
jan 1, 1971
663.862
+83.889
14.46%
jan 1, 1972
726.05
+62.189
9.37%
jan 1, 1973
745.284
+19.233
2.65%
jan 1, 1974
798.835
+53.551
7.19%
jan 1, 1975
824.361
+25.526
3.2%
jan 1, 1976
845.362
+21.001
2.55%
jan 1, 1977
872.349
+26.987
3.19%
jan 1, 1978
845.369
-26.98
-3.09%
jan 1, 1979
916.769
+71.4
8.45%
jan 1, 1980
998.161
+81.391
8.88%
jan 1, 1981
1.022K
+24.303
2.43%
jan 1, 1982
1.006K
-15.97
-1.56%
jan 1, 1983
1.119K
+112.711
11.2%
jan 1, 1984
1.118K
-1.292
-0.12%
jan 1, 1985
1.116K
-2.019
-0.18%
jan 1, 1986
1.094K
-22.036
-1.97%
jan 1, 1987
1.208K
+114.616
10.48%
jan 1, 1988
1.241K
+32.721
2.71%
jan 1, 1989
1.3K
+58.389
4.7%
jan 1, 1990
1.576K
+276.169
21.25%
jan 1, 1991
1.681K
+105.208
6.68%
jan 1, 1992
1.703K
+22.354
1.33%
jan 1, 1993
1.814K
+110.569
6.49%
jan 1, 1994
1.786K
-27.434
-1.51%
jan 1, 1995
1.828K
+41.245
2.31%
jan 1, 1996
2.014K
+186.324
10.19%
jan 1, 1997
1.987K
-27.184
-1.35%
jan 1, 1998
2.083K
+96.651
4.86%
jan 1, 1999
2.24K
+156.58
7.52%
jan 1, 2000
2.39K
+150.427
6.72%
jan 1, 2001
2.39K
-0.397
-0.02%
jan 1, 2002
2.391K
+1.13
0.05%
jan 1, 2003
2.477K
+86.262
3.61%
jan 1, 2004
2.401K
-76.724
-3.1%
jan 1, 2005
2.463K
+62.219
2.59%
jan 1, 2006
2.519K
+56.02
2.27%
jan 1, 2007
2.39K
-128.68
-5.11%
jan 1, 2008
2.402K
+12.153
0.51%
jan 1, 2009
2.337K
-65.169
-2.71%
jan 1, 2010
2.304K
-33.23
-1.42%
jan 1, 2011
2.223K
-81.462
-3.54%
jan 1, 2012
2.164K
-58.673
-2.64%
jan 1, 2013
2.06K
-104.055
-4.81%
jan 1, 2014
2.083K
+22.921
1.11%
jan 1, 2015
2.028K
-54.729
-2.63%
Ranking of countries by current statistics by years


Comments: