29
/
en
AIzaSyAYiBZKx7MnpbEhh9jyipgxe19OcubqV5w
April 1, 2024
124711
Egypt, Arab Rep.
EGY
true
2
1
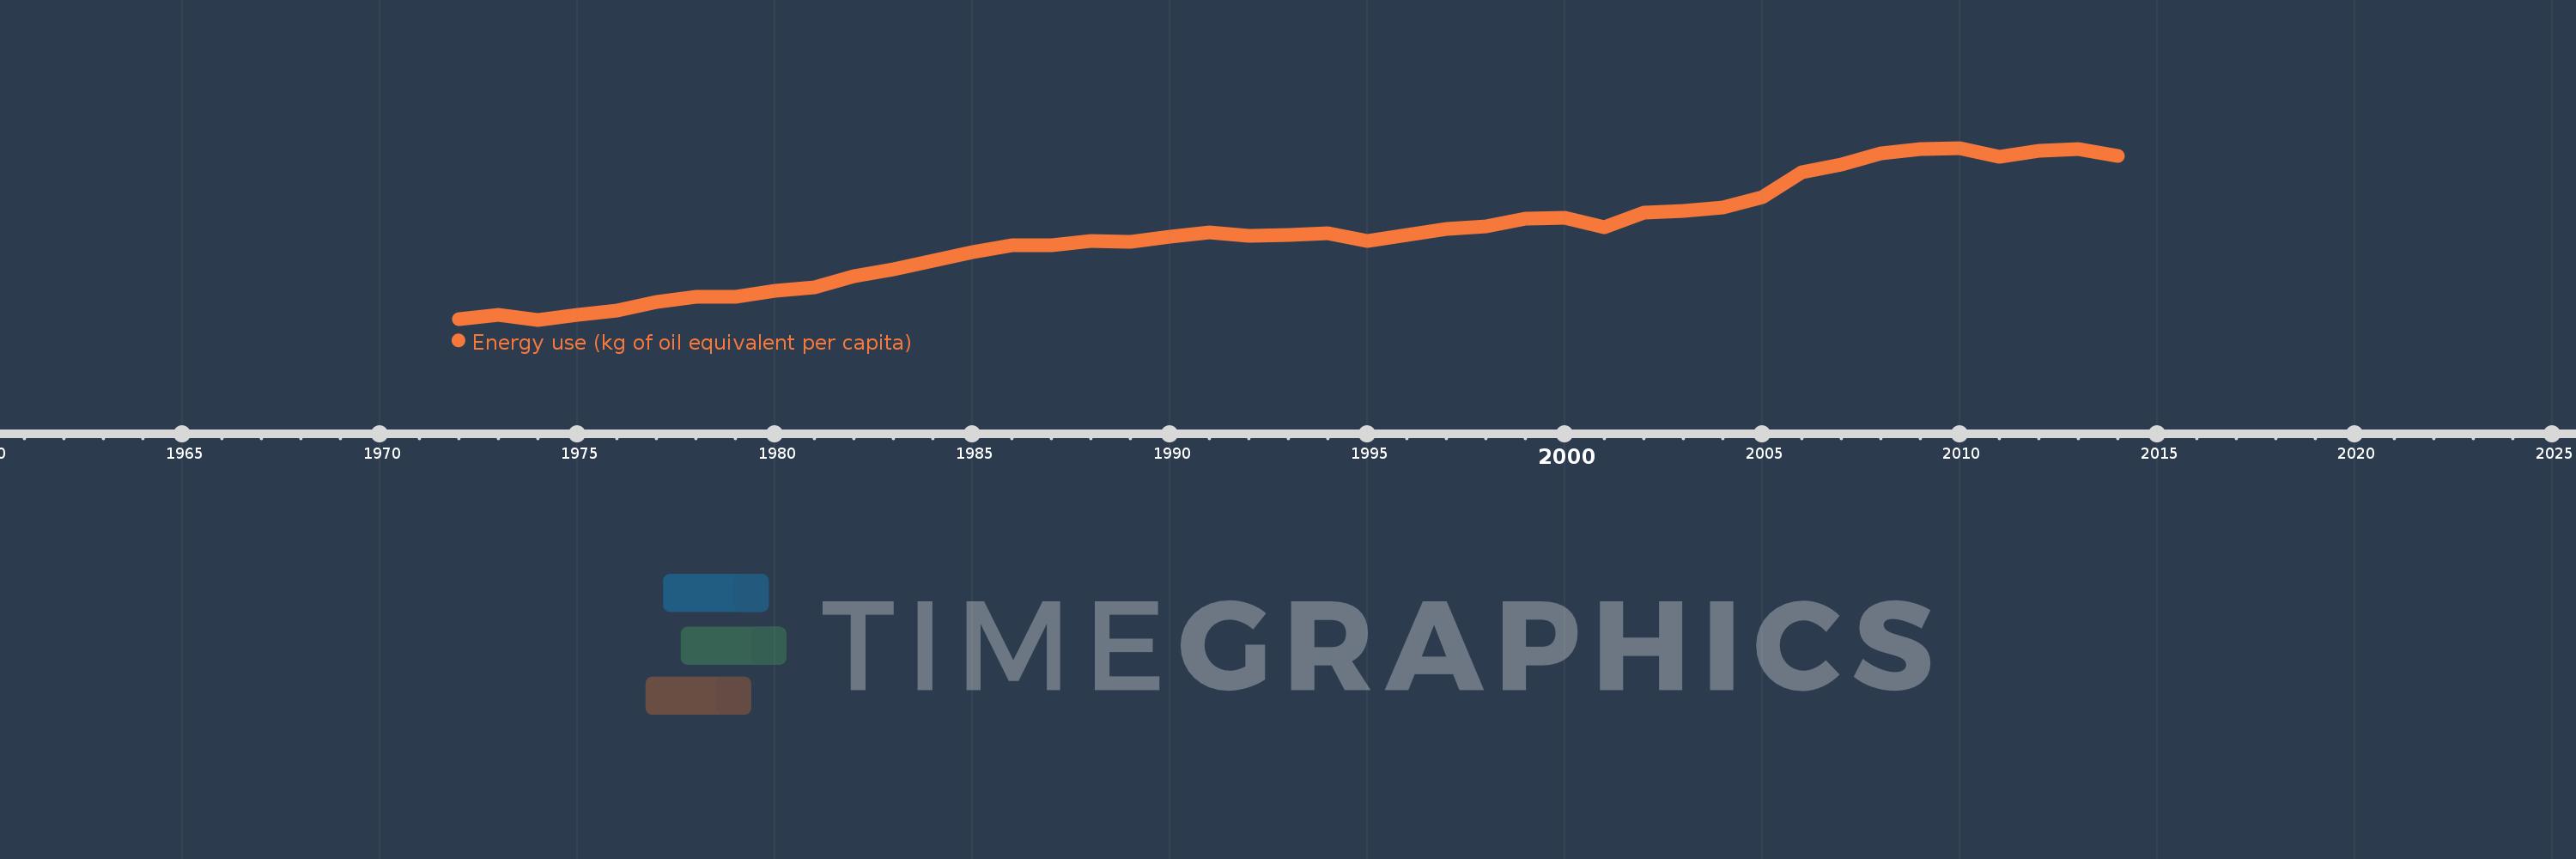
Energy use (kg of oil equivalent per capita)
2014,2013,2012,2011,2010,2009,2008,2007,2006,2005,2004,2003,2002,2001,2000,1999,1998,1997,1996,1995,1994,1993,1992,1991,1990,1989,1988,1987,1986,1985,1984,1983,1982,1981,1980,1979,1978,1977,1976,1975,1974,1973,1972
This statistics in other country:
AlbaniaAlgeriaAngolaAntigua and BarbudaArab WorldArgentinaArmeniaAustraliaAustriaAzerbaijanBahamas, TheBahrainBangladeshBarbadosBelarusBelgiumBelizeBeninBhutanBoliviaBosnia and HerzegovinaBotswanaBrazilBrunei DarussalamBulgariaCabo VerdeCambodiaCameroonCanadaCaribbean small statesCentral Europe and the BalticsChileChinaColombiaComorosCongo, Dem. Rep.Congo, Rep.Costa RicaCote d'IvoireCroatiaCubaCuracaoCyprusCzech RepublicDenmarkDjiboutiDominicaDominican RepublicEarly-demographic dividendEast Asia & PacificEast Asia & Pacific (excluding high income)East Asia & Pacific (IDA & IBRD countries)EcuadorEgypt, Arab Rep.El SalvadorEquatorial GuineaEritreaEstoniaEthiopiaEuro areaEurope & Central AsiaEurope & Central Asia (excluding high income)Europe & Central Asia (IDA & IBRD countries)European UnionFijiFinlandFragile and conflict affected situationsFranceGabonGambia, TheGeorgiaGermanyGhanaGibraltarGreeceGrenadaGuatemalaGuinea-BissauGuyanaHaitiHeavily indebted poor countries (HIPC)High incomeHondurasHong Kong SAR, ChinaHungaryIBRD onlyIcelandIDA & IBRD totalIDA blendIDA onlyIDA totalIndiaIndonesiaIran, Islamic Rep.IraqIrelandIsraelItalyJamaicaJapanJordanKazakhstanKenyaKiribatiKorea, Dem. People’s Rep.Korea, Rep.KosovoKuwaitKyrgyz RepublicLate-demographic dividendLatin America & Caribbean Latin America & Caribbean (excluding high income)Latin America & the Caribbean (IDA & IBRD countries)LatviaLeast developed countries: UN classificationLebanonLesothoLibyaLithuaniaLow & middle incomeLower middle incomeLuxembourgMacedonia, FYRMalaysiaMaldivesMaltaMarshall IslandsMauritiusMexicoMiddle East & North AfricaMiddle East & North Africa (excluding high income)Middle East & North Africa (IDA & IBRD countries)Middle incomeMoldovaMongoliaMontenegroMoroccoMozambiqueMyanmarNamibiaNepalNetherlandsNew ZealandNicaraguaNigerNigeriaNorth AmericaNorwayOECD membersOmanOther small statesPacific island small statesPakistanPalauPanamaParaguayPeruPhilippinesPolandPortugalPost-demographic dividendPre-demographic dividendQatarRomaniaRussian FederationSamoaSao Tome and PrincipeSaudi ArabiaSenegalSerbiaSeychellesSingaporeSlovak RepublicSloveniaSmall statesSolomon IslandsSouth AfricaSouth AsiaSouth Asia (IDA & IBRD)South SudanSpainSri LankaSt. Kitts and NevisSt. LuciaSt. Vincent and the GrenadinesSub-Saharan Africa Sub-Saharan Africa (excluding high income)Sub-Saharan Africa (IDA & IBRD countries)SudanSurinameSwazilandSwedenSwitzerlandSyrian Arab RepublicTajikistanTanzaniaThailandTimor-LesteTogoTongaTrinidad and TobagoTunisiaTurkeyTurkmenistanUkraineUnited Arab EmiratesUnited KingdomUnited StatesUpper middle incomeUruguayUzbekistanVanuatuVenezuela, RBVietnamWorldYemen, Rep.ZambiaZimbabwe Timeline:
This timeline shows a graph from 1972 to 2014 of Egypt, Arab Rep.. No data until 1971. Number of actual observations by date: 43.
Source name:
World Development Indicators
Source organization:
IEA Statistics © OECD/IEA 2014 (http://www.iea.org/stats/index.asp), subject to https://www.iea.org/t&c/termsandconditions/
Categories, topics:
Energy & Mining, Climate Change
Last updated:
apr 23, 2017
Indicators value changes by year
Minimum:
216.16
jan 1, 1974
Maximum:
919.068
jan 1, 2010
At the date of observation
Value
Absolute change
Change from previous value
jan 1, 1972
219.321
+219.321
0.0%
jan 1, 1973
236.938
+17.617
8.03%
jan 1, 1974
216.16
-20.778
-8.77%
jan 1, 1975
237.171
+21.011
9.72%
jan 1, 1976
253.519
+16.348
6.89%
jan 1, 1977
288.907
+35.388
13.96%
jan 1, 1978
308.424
+19.517
6.76%
jan 1, 1979
310.603
+2.179
0.71%
jan 1, 1980
333.686
+23.083
7.43%
jan 1, 1981
348.054
+14.368
4.31%
jan 1, 1982
395.58
+47.525
13.65%
jan 1, 1983
422.347
+26.767
6.77%
jan 1, 1984
456.657
+34.31
8.12%
jan 1, 1985
493.149
+36.492
7.99%
jan 1, 1986
519.617
+26.468
5.37%
jan 1, 1987
519.302
-0.315
-0.06%
jan 1, 1988
538.201
+18.899
3.64%
jan 1, 1989
536.273
-1.928
-0.36%
jan 1, 1990
557.09
+20.817
3.88%
jan 1, 1991
571.852
+14.762
2.65%
jan 1, 1992
559.353
-12.499
-2.19%
jan 1, 1993
561.965
+2.612
0.47%
jan 1, 1994
571.23
+9.265
1.65%
jan 1, 1995
539.103
-32.127
-5.62%
jan 1, 1996
562.639
+23.536
4.37%
jan 1, 1997
586.274
+23.636
4.2%
jan 1, 1998
599.669
+13.394
2.28%
jan 1, 1999
631.165
+31.497
5.25%
jan 1, 2000
633.816
+2.65
0.42%
jan 1, 2001
593.953
-39.862
-6.29%
jan 1, 2002
654.856
+60.903
10.25%
jan 1, 2003
663.006
+8.15
1.24%
jan 1, 2004
675.482
+12.476
1.88%
jan 1, 2005
716.742
+41.261
6.11%
jan 1, 2006
820.116
+103.373
14.42%
jan 1, 2007
851.412
+31.297
3.82%
jan 1, 2008
896.348
+44.936
5.28%
jan 1, 2009
914.943
+18.595
2.07%
jan 1, 2010
919.068
+4.125
0.45%
jan 1, 2011
883.918
-35.15
-3.82%
jan 1, 2012
908.22
+24.302
2.75%
jan 1, 2013
913.132
+4.912
0.54%
jan 1, 2014
884.992
-28.139
-3.08%
Ranking of countries by current statistics by years


Comments: