29
/
en
AIzaSyAYiBZKx7MnpbEhh9jyipgxe19OcubqV5w
April 1, 2024
49962
Middle East & North Africa (IDA & IBRD countries)
TMN
false
2
1
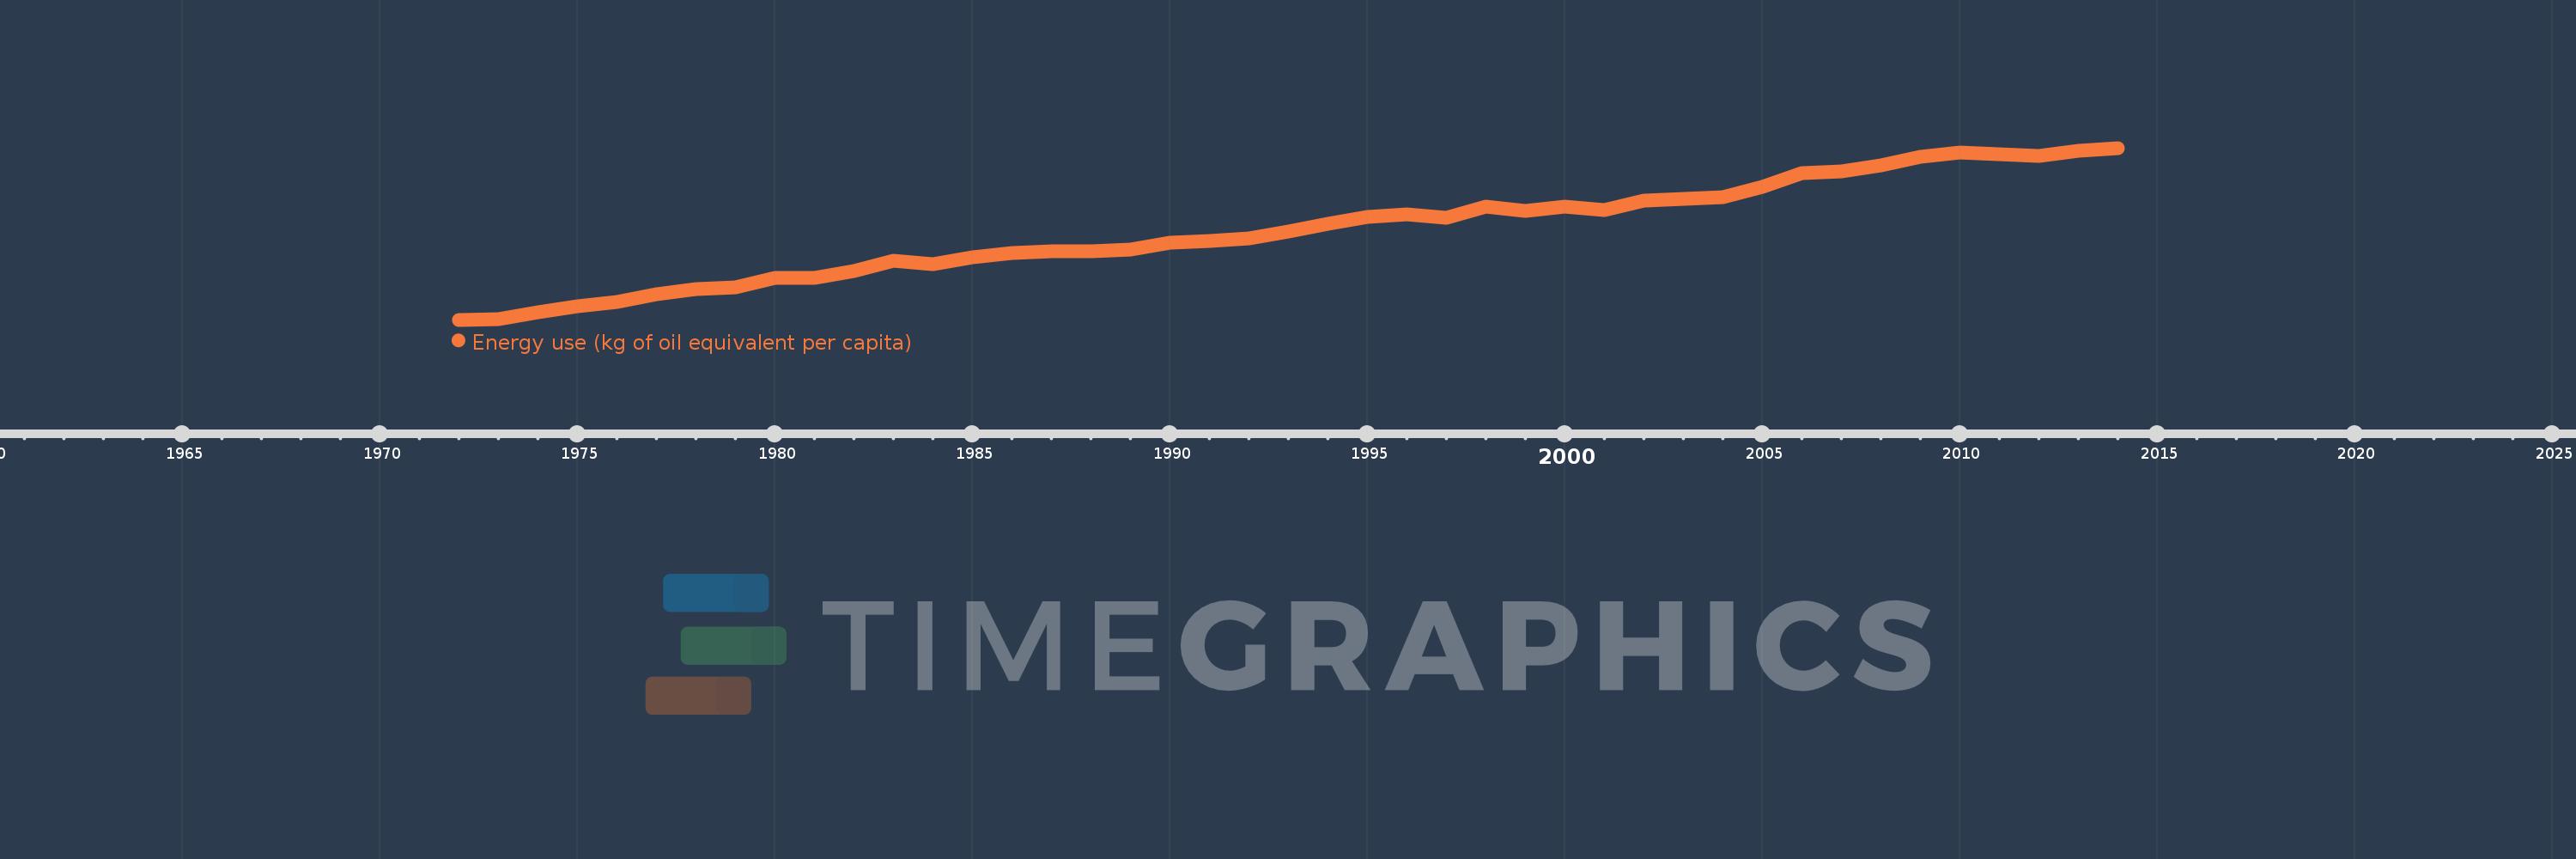
Energy use (kg of oil equivalent per capita)
2014,2013,2012,2011,2010,2009,2008,2007,2006,2005,2004,2003,2002,2001,2000,1999,1998,1997,1996,1995,1994,1993,1992,1991,1990,1989,1988,1987,1986,1985,1984,1983,1982,1981,1980,1979,1978,1977,1976,1975,1974,1973,1972
This statistics in other country:
AlbaniaAlgeriaAngolaAntigua and BarbudaArab WorldArgentinaArmeniaAustraliaAustriaAzerbaijanBahamas, TheBahrainBangladeshBarbadosBelarusBelgiumBelizeBeninBhutanBoliviaBosnia and HerzegovinaBotswanaBrazilBrunei DarussalamBulgariaCabo VerdeCambodiaCameroonCanadaCaribbean small statesCentral Europe and the BalticsChileChinaColombiaComorosCongo, Dem. Rep.Congo, Rep.Costa RicaCote d'IvoireCroatiaCubaCuracaoCyprusCzech RepublicDenmarkDjiboutiDominicaDominican RepublicEarly-demographic dividendEast Asia & PacificEast Asia & Pacific (excluding high income)East Asia & Pacific (IDA & IBRD countries)EcuadorEgypt, Arab Rep.El SalvadorEquatorial GuineaEritreaEstoniaEthiopiaEuro areaEurope & Central AsiaEurope & Central Asia (excluding high income)Europe & Central Asia (IDA & IBRD countries)European UnionFijiFinlandFragile and conflict affected situationsFranceGabonGambia, TheGeorgiaGermanyGhanaGibraltarGreeceGrenadaGuatemalaGuinea-BissauGuyanaHaitiHeavily indebted poor countries (HIPC)High incomeHondurasHong Kong SAR, ChinaHungaryIBRD onlyIcelandIDA & IBRD totalIDA blendIDA onlyIDA totalIndiaIndonesiaIran, Islamic Rep.IraqIrelandIsraelItalyJamaicaJapanJordanKazakhstanKenyaKiribatiKorea, Dem. People’s Rep.Korea, Rep.KosovoKuwaitKyrgyz RepublicLate-demographic dividendLatin America & Caribbean Latin America & Caribbean (excluding high income)Latin America & the Caribbean (IDA & IBRD countries)LatviaLeast developed countries: UN classificationLebanonLesothoLibyaLithuaniaLow & middle incomeLower middle incomeLuxembourgMacedonia, FYRMalaysiaMaldivesMaltaMarshall IslandsMauritiusMexicoMiddle East & North AfricaMiddle East & North Africa (excluding high income)Middle East & North Africa (IDA & IBRD countries)Middle incomeMoldovaMongoliaMontenegroMoroccoMozambiqueMyanmarNamibiaNepalNetherlandsNew ZealandNicaraguaNigerNigeriaNorth AmericaNorwayOECD membersOmanOther small statesPacific island small statesPakistanPalauPanamaParaguayPeruPhilippinesPolandPortugalPost-demographic dividendPre-demographic dividendQatarRomaniaRussian FederationSamoaSao Tome and PrincipeSaudi ArabiaSenegalSerbiaSeychellesSingaporeSlovak RepublicSloveniaSmall statesSolomon IslandsSouth AfricaSouth AsiaSouth Asia (IDA & IBRD)South SudanSpainSri LankaSt. Kitts and NevisSt. LuciaSt. Vincent and the GrenadinesSub-Saharan Africa Sub-Saharan Africa (excluding high income)Sub-Saharan Africa (IDA & IBRD countries)SudanSurinameSwazilandSwedenSwitzerlandSyrian Arab RepublicTajikistanTanzaniaThailandTimor-LesteTogoTongaTrinidad and TobagoTunisiaTurkeyTurkmenistanUkraineUnited Arab EmiratesUnited KingdomUnited StatesUpper middle incomeUruguayUzbekistanVanuatuVenezuela, RBVietnamWorldYemen, Rep.ZambiaZimbabwe Timeline:
This timeline shows a graph from 1972 to 2014 of Middle East & North Africa (IDA & IBRD countries). No data until 1971. Number of actual observations by date: 43.
Source name:
World Development Indicators
Source organization:
IEA Statistics © OECD/IEA 2014 (http://www.iea.org/stats/index.asp), subject to https://www.iea.org/t&c/termsandconditions/
Categories, topics:
Energy & Mining, Climate Change
Last updated:
apr 23, 2017
Indicators value changes by year
Minimum:
332.788
jan 1, 1972
Maximum:
1.408K
jan 1, 2014
At the date of observation
Value
Absolute change
Change from previous value
jan 1, 1972
332.788
+332.788
0.0%
jan 1, 1973
338.548
+5.76
1.73%
jan 1, 1974
379.407
+40.859
12.07%
jan 1, 1975
419.259
+39.852
10.5%
jan 1, 1976
445.689
+26.429
6.3%
jan 1, 1977
491.555
+45.866
10.29%
jan 1, 1978
524.763
+33.208
6.76%
jan 1, 1979
536.294
+11.531
2.2%
jan 1, 1980
597.015
+60.721
11.32%
jan 1, 1981
597.112
+0.096
0.02%
jan 1, 1982
637.456
+40.344
6.76%
jan 1, 1983
701.682
+64.226
10.08%
jan 1, 1984
682.004
-19.679
-2.8%
jan 1, 1985
724.324
+42.32
6.21%
jan 1, 1986
751.022
+26.698
3.69%
jan 1, 1987
758.958
+7.936
1.06%
jan 1, 1988
761.789
+2.831
0.37%
jan 1, 1989
769.425
+7.636
1.0%
jan 1, 1990
816.957
+47.532
6.18%
jan 1, 1991
826.467
+9.51
1.16%
jan 1, 1992
843.6
+17.133
2.07%
jan 1, 1993
886.273
+42.673
5.06%
jan 1, 1994
931.915
+45.642
5.15%
jan 1, 1995
975.049
+43.134
4.63%
jan 1, 1996
990.482
+15.433
1.58%
jan 1, 1997
972.675
-17.808
-1.8%
jan 1, 1998
1.043K
+70.131
7.21%
jan 1, 1999
1.012K
-30.779
-2.95%
jan 1, 2000
1.039K
+27.208
2.69%
jan 1, 2001
1.022K
-17.654
-1.7%
jan 1, 2002
1.08K
+58.309
5.71%
jan 1, 2003
1.092K
+11.675
1.08%
jan 1, 2004
1.102K
+10.304
0.94%
jan 1, 2005
1.162K
+60.121
5.46%
jan 1, 2006
1.249K
+87.327
7.52%
jan 1, 2007
1.262K
+12.471
1.0%
jan 1, 2008
1.3K
+38.334
3.04%
jan 1, 2009
1.353K
+52.819
4.06%
jan 1, 2010
1.378K
+24.805
1.83%
jan 1, 2011
1.37K
-7.651
-0.56%
jan 1, 2012
1.356K
-13.85
-1.01%
jan 1, 2013
1.389K
+32.821
2.42%
jan 1, 2014
1.408K
+18.945
1.36%
Ranking of countries by current statistics by years


Comments: