29
/
en
AIzaSyAYiBZKx7MnpbEhh9jyipgxe19OcubqV5w
April 1, 2024
105899
China
CHN
true
2
1
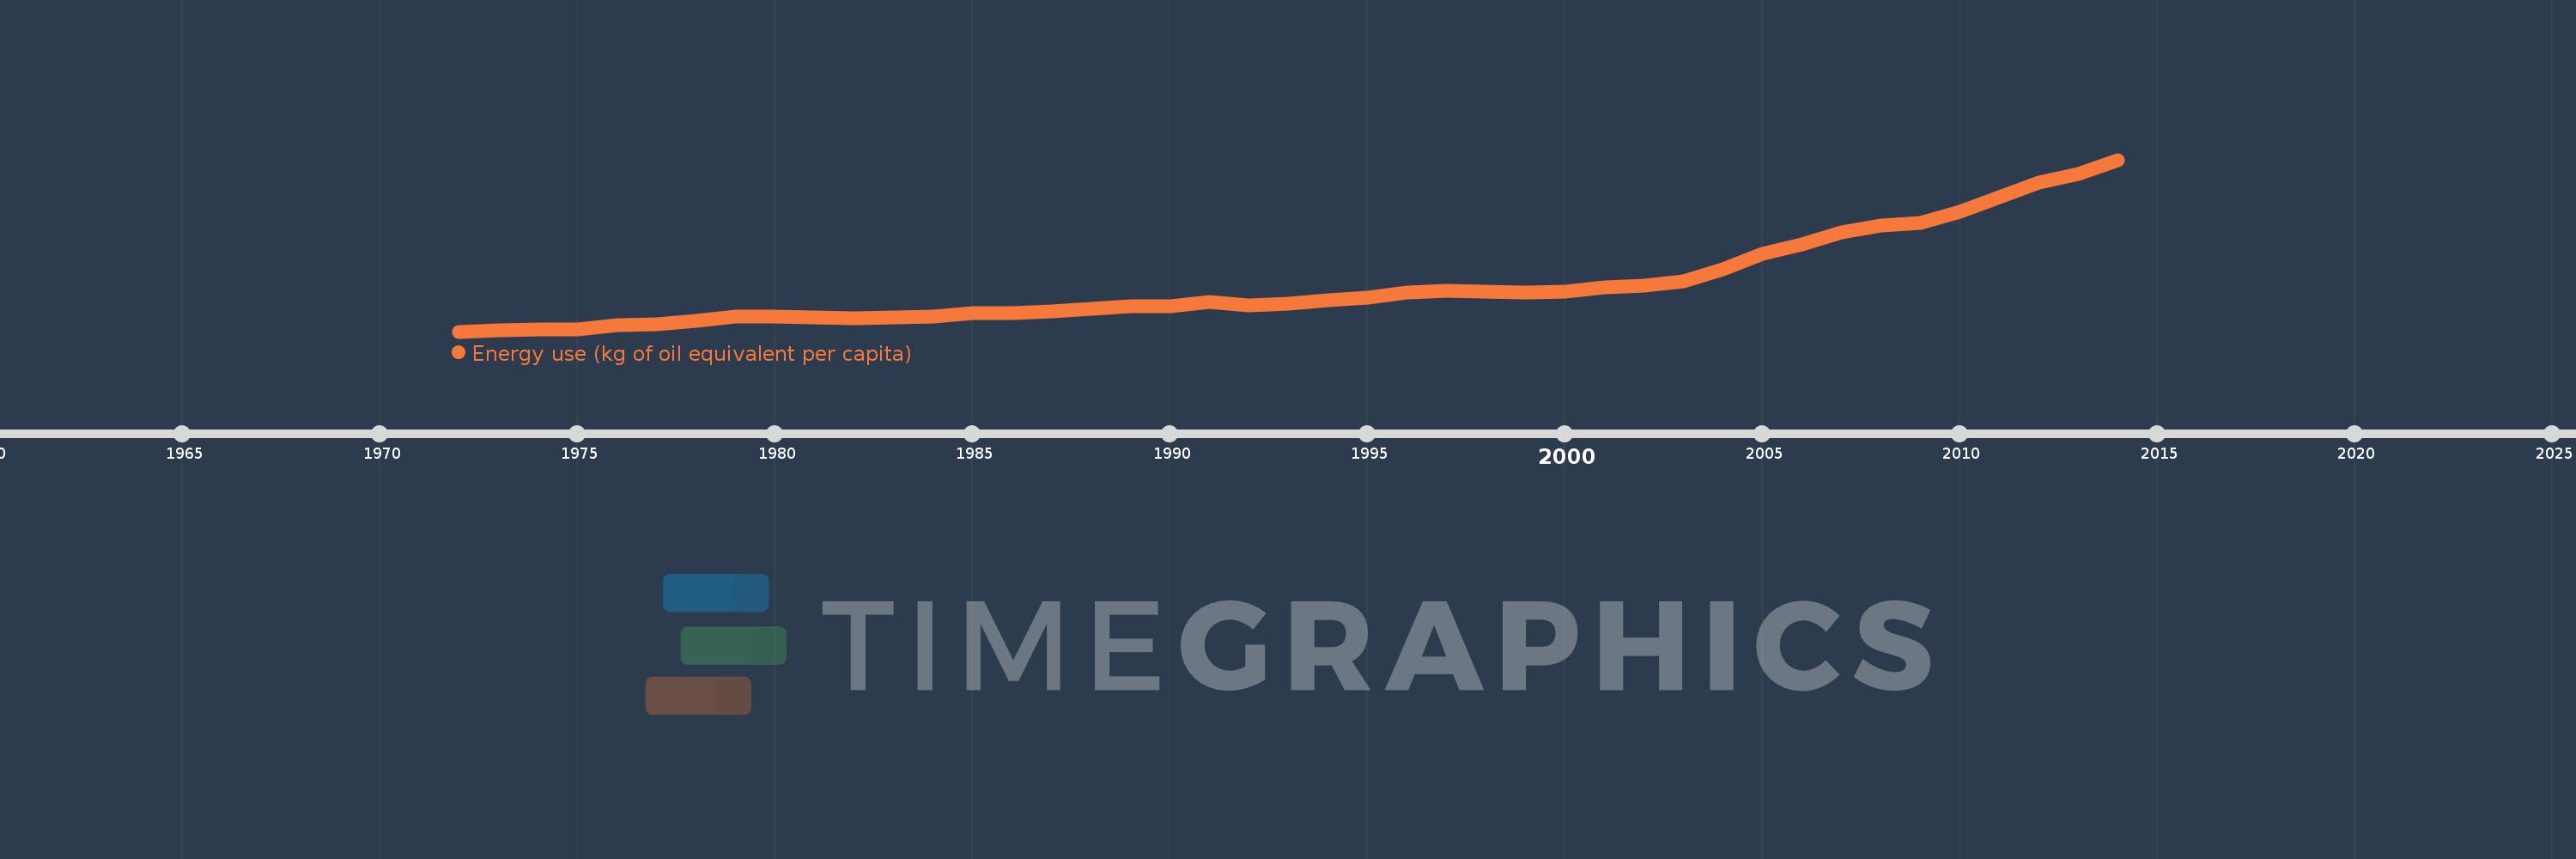
Energy use (kg of oil equivalent per capita)
2014,2013,2012,2011,2010,2009,2008,2007,2006,2005,2004,2003,2002,2001,2000,1999,1998,1997,1996,1995,1994,1993,1992,1991,1990,1989,1988,1987,1986,1985,1984,1983,1982,1981,1980,1979,1978,1977,1976,1975,1974,1973,1972
This statistics in other country:
AlbaniaAlgeriaAngolaAntigua and BarbudaArab WorldArgentinaArmeniaAustraliaAustriaAzerbaijanBahamas, TheBahrainBangladeshBarbadosBelarusBelgiumBelizeBeninBhutanBoliviaBosnia and HerzegovinaBotswanaBrazilBrunei DarussalamBulgariaCabo VerdeCambodiaCameroonCanadaCaribbean small statesCentral Europe and the BalticsChileChinaColombiaComorosCongo, Dem. Rep.Congo, Rep.Costa RicaCote d'IvoireCroatiaCubaCuracaoCyprusCzech RepublicDenmarkDjiboutiDominicaDominican RepublicEarly-demographic dividendEast Asia & PacificEast Asia & Pacific (excluding high income)East Asia & Pacific (IDA & IBRD countries)EcuadorEgypt, Arab Rep.El SalvadorEquatorial GuineaEritreaEstoniaEthiopiaEuro areaEurope & Central AsiaEurope & Central Asia (excluding high income)Europe & Central Asia (IDA & IBRD countries)European UnionFijiFinlandFragile and conflict affected situationsFranceGabonGambia, TheGeorgiaGermanyGhanaGibraltarGreeceGrenadaGuatemalaGuinea-BissauGuyanaHaitiHeavily indebted poor countries (HIPC)High incomeHondurasHong Kong SAR, ChinaHungaryIBRD onlyIcelandIDA & IBRD totalIDA blendIDA onlyIDA totalIndiaIndonesiaIran, Islamic Rep.IraqIrelandIsraelItalyJamaicaJapanJordanKazakhstanKenyaKiribatiKorea, Dem. People’s Rep.Korea, Rep.KosovoKuwaitKyrgyz RepublicLate-demographic dividendLatin America & Caribbean Latin America & Caribbean (excluding high income)Latin America & the Caribbean (IDA & IBRD countries)LatviaLeast developed countries: UN classificationLebanonLesothoLibyaLithuaniaLow & middle incomeLower middle incomeLuxembourgMacedonia, FYRMalaysiaMaldivesMaltaMarshall IslandsMauritiusMexicoMiddle East & North AfricaMiddle East & North Africa (excluding high income)Middle East & North Africa (IDA & IBRD countries)Middle incomeMoldovaMongoliaMontenegroMoroccoMozambiqueMyanmarNamibiaNepalNetherlandsNew ZealandNicaraguaNigerNigeriaNorth AmericaNorwayOECD membersOmanOther small statesPacific island small statesPakistanPalauPanamaParaguayPeruPhilippinesPolandPortugalPost-demographic dividendPre-demographic dividendQatarRomaniaRussian FederationSamoaSao Tome and PrincipeSaudi ArabiaSenegalSerbiaSeychellesSingaporeSlovak RepublicSloveniaSmall statesSolomon IslandsSouth AfricaSouth AsiaSouth Asia (IDA & IBRD)South SudanSpainSri LankaSt. Kitts and NevisSt. LuciaSt. Vincent and the GrenadinesSub-Saharan Africa Sub-Saharan Africa (excluding high income)Sub-Saharan Africa (IDA & IBRD countries)SudanSurinameSwazilandSwedenSwitzerlandSyrian Arab RepublicTajikistanTanzaniaThailandTimor-LesteTogoTongaTrinidad and TobagoTunisiaTurkeyTurkmenistanUkraineUnited Arab EmiratesUnited KingdomUnited StatesUpper middle incomeUruguayUzbekistanVanuatuVenezuela, RBVietnamWorldYemen, Rep.ZambiaZimbabwe Timeline:
This timeline shows a graph from 1972 to 2014 of China. No data until 1971. Number of actual observations by date: 43.
Source name:
World Development Indicators
Source organization:
IEA Statistics © OECD/IEA 2014 (http://www.iea.org/stats/index.asp), subject to https://www.iea.org/t&c/termsandconditions/
Categories, topics:
Energy & Mining, Climate Change
Last updated:
apr 23, 2017
Indicators value changes by year
Minimum:
464.933
jan 1, 1972
Maximum:
2.226K
jan 1, 2014
At the date of observation
Value
Absolute change
Change from previous value
jan 1, 1972
464.933
+464.933
0.0%
jan 1, 1973
477.169
+12.236
2.63%
jan 1, 1974
483.717
+6.549
1.37%
jan 1, 1975
486.168
+2.451
0.51%
jan 1, 1976
527.488
+41.32
8.5%
jan 1, 1977
537.175
+9.686
1.84%
jan 1, 1978
577.211
+40.036
7.45%
jan 1, 1979
617.155
+39.944
6.92%
jan 1, 1980
619.044
+1.889
0.31%
jan 1, 1981
609.455
-9.588
-1.55%
jan 1, 1982
597.147
-12.308
-2.02%
jan 1, 1983
606.83
+9.684
1.62%
jan 1, 1984
621.911
+15.08
2.49%
jan 1, 1985
651.075
+29.164
4.69%
jan 1, 1986
657.76
+6.685
1.03%
jan 1, 1987
671.21
+13.45
2.04%
jan 1, 1988
694.422
+23.213
3.46%
jan 1, 1989
720.341
+25.919
3.73%
jan 1, 1990
724.116
+3.775
0.52%
jan 1, 1991
766.995
+42.879
5.92%
jan 1, 1992
736.852
-30.144
-3.93%
jan 1, 1993
752.629
+15.777
2.14%
jan 1, 1994
788.129
+35.5
4.72%
jan 1, 1995
816.163
+28.034
3.56%
jan 1, 1996
866.848
+50.685
6.21%
jan 1, 1997
881.538
+14.69
1.69%
jan 1, 1998
871.646
-9.892
-1.12%
jan 1, 1999
869.111
-2.535
-0.29%
jan 1, 2000
878.197
+9.086
1.05%
jan 1, 2001
919.321
+41.124
4.68%
jan 1, 2002
932.559
+13.237
1.44%
jan 1, 2003
978.619
+46.06
4.94%
jan 1, 2004
1.107K
+128.694
13.15%
jan 1, 2005
1.265K
+157.234
14.2%
jan 1, 2006
1.362K
+97.145
7.68%
jan 1, 2007
1.478K
+116.463
8.55%
jan 1, 2008
1.551K
+72.375
4.9%
jan 1, 2009
1.576K
+25.651
1.65%
jan 1, 2010
1.693K
+116.499
7.39%
jan 1, 2011
1.846K
+153.057
9.04%
jan 1, 2012
1.994K
+148.662
8.05%
jan 1, 2013
2.079K
+84.72
4.25%
jan 1, 2014
2.226K
+147.15
7.08%
Ranking of countries by current statistics by years


Comments: