29
/
en
AIzaSyAYiBZKx7MnpbEhh9jyipgxe19OcubqV5w
April 1, 2024
139193
Germany
DEU
true
2
1
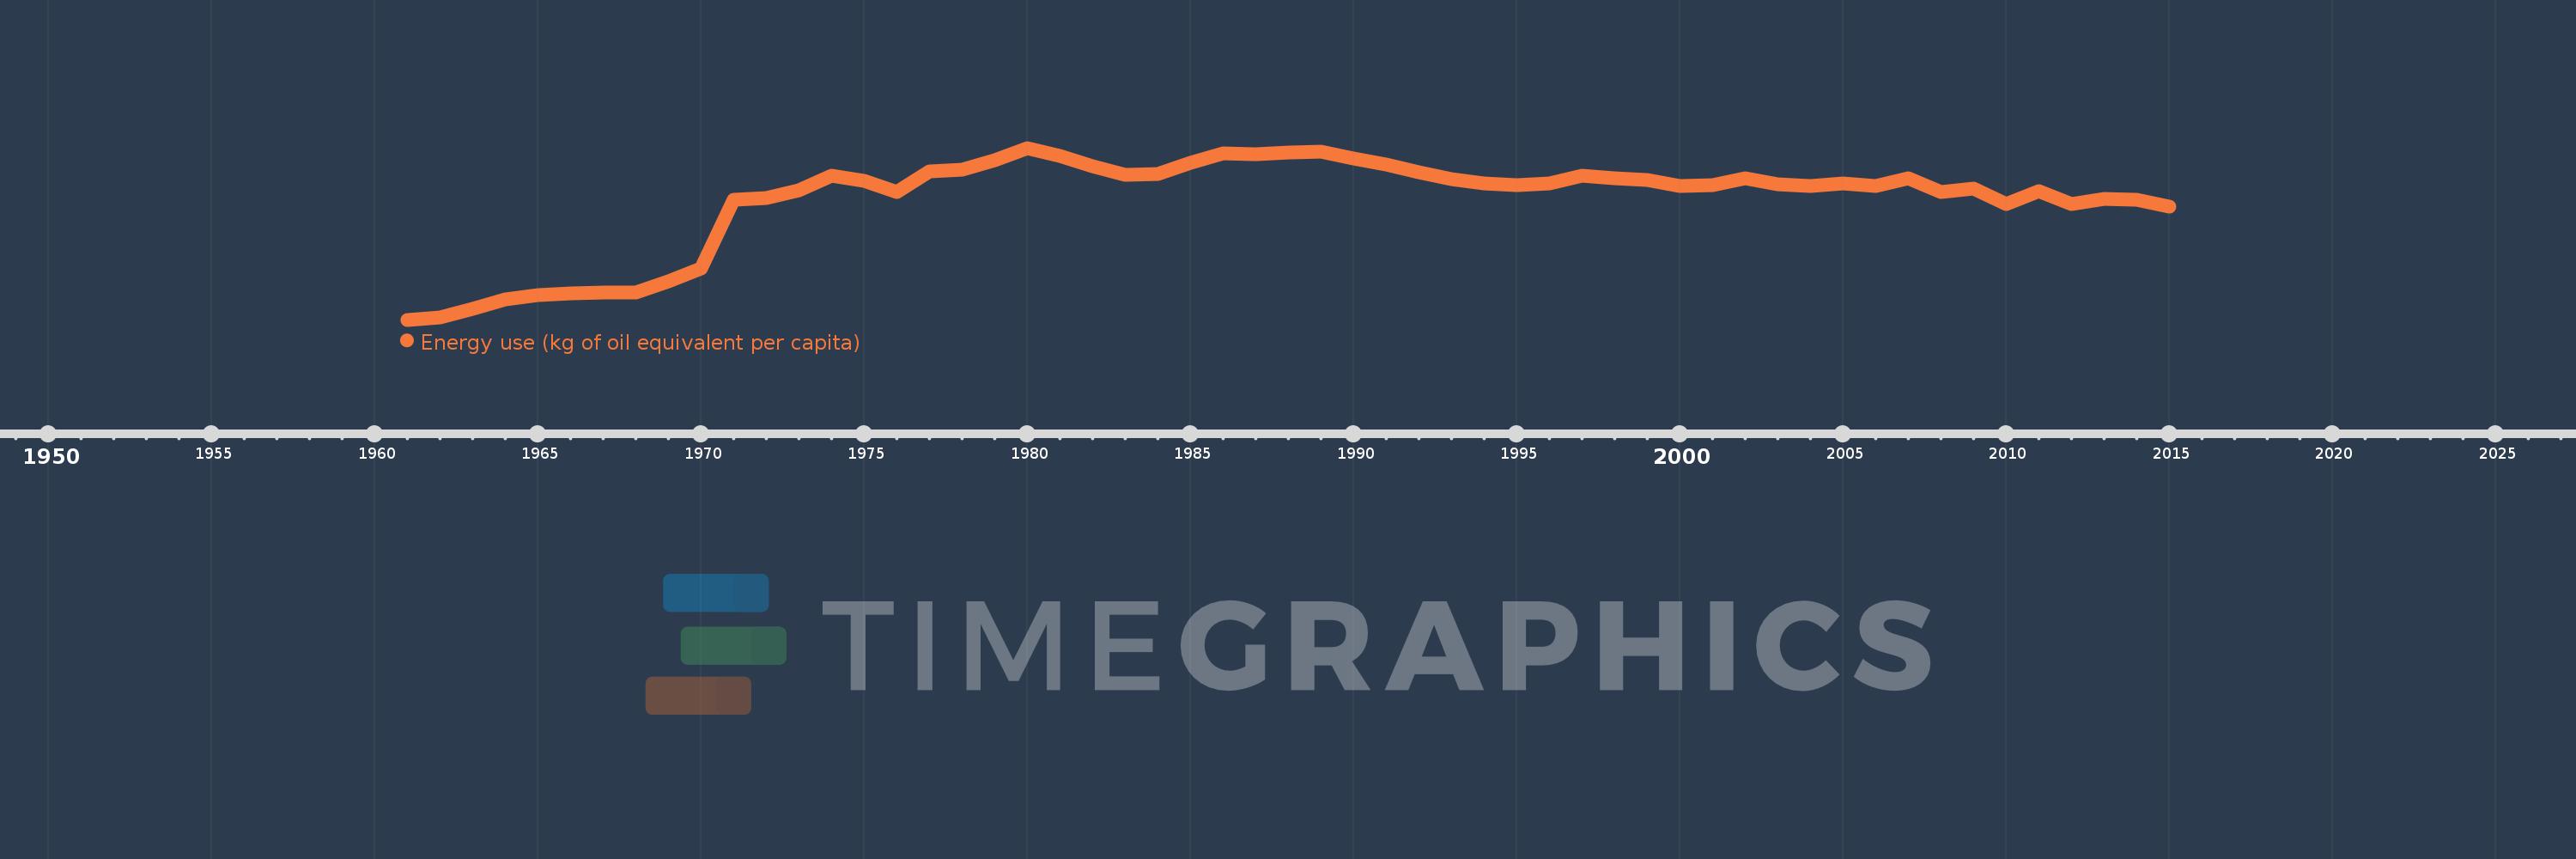
Energy use (kg of oil equivalent per capita)
2015,2014,2013,2012,2011,2010,2009,2008,2007,2006,2005,2004,2003,2002,2001,2000,1999,1998,1997,1996,1995,1994,1993,1992,1991,1990,1989,1988,1987,1986,1985,1984,1983,1982,1981,1980,1979,1978,1977,1976,1975,1974,1973,1972,1971,1970,1969,1968,1967,1966,1965,1964,1963,1962,1961
This statistics in other country:
AlbaniaAlgeriaAngolaAntigua and BarbudaArab WorldArgentinaArmeniaAustraliaAustriaAzerbaijanBahamas, TheBahrainBangladeshBarbadosBelarusBelgiumBelizeBeninBhutanBoliviaBosnia and HerzegovinaBotswanaBrazilBrunei DarussalamBulgariaCabo VerdeCambodiaCameroonCanadaCaribbean small statesCentral Europe and the BalticsChileChinaColombiaComorosCongo, Dem. Rep.Congo, Rep.Costa RicaCote d'IvoireCroatiaCubaCuracaoCyprusCzech RepublicDenmarkDjiboutiDominicaDominican RepublicEarly-demographic dividendEast Asia & PacificEast Asia & Pacific (excluding high income)East Asia & Pacific (IDA & IBRD countries)EcuadorEgypt, Arab Rep.El SalvadorEquatorial GuineaEritreaEstoniaEthiopiaEuro areaEurope & Central AsiaEurope & Central Asia (excluding high income)Europe & Central Asia (IDA & IBRD countries)European UnionFijiFinlandFragile and conflict affected situationsFranceGabonGambia, TheGeorgiaGermanyGhanaGibraltarGreeceGrenadaGuatemalaGuinea-BissauGuyanaHaitiHeavily indebted poor countries (HIPC)High incomeHondurasHong Kong SAR, ChinaHungaryIBRD onlyIcelandIDA & IBRD totalIDA blendIDA onlyIDA totalIndiaIndonesiaIran, Islamic Rep.IraqIrelandIsraelItalyJamaicaJapanJordanKazakhstanKenyaKiribatiKorea, Dem. People’s Rep.Korea, Rep.KosovoKuwaitKyrgyz RepublicLate-demographic dividendLatin America & Caribbean Latin America & Caribbean (excluding high income)Latin America & the Caribbean (IDA & IBRD countries)LatviaLeast developed countries: UN classificationLebanonLesothoLibyaLithuaniaLow & middle incomeLower middle incomeLuxembourgMacedonia, FYRMalaysiaMaldivesMaltaMarshall IslandsMauritiusMexicoMiddle East & North AfricaMiddle East & North Africa (excluding high income)Middle East & North Africa (IDA & IBRD countries)Middle incomeMoldovaMongoliaMontenegroMoroccoMozambiqueMyanmarNamibiaNepalNetherlandsNew ZealandNicaraguaNigerNigeriaNorth AmericaNorwayOECD membersOmanOther small statesPacific island small statesPakistanPalauPanamaParaguayPeruPhilippinesPolandPortugalPost-demographic dividendPre-demographic dividendQatarRomaniaRussian FederationSamoaSao Tome and PrincipeSaudi ArabiaSenegalSerbiaSeychellesSingaporeSlovak RepublicSloveniaSmall statesSolomon IslandsSouth AfricaSouth AsiaSouth Asia (IDA & IBRD)South SudanSpainSri LankaSt. Kitts and NevisSt. LuciaSt. Vincent and the GrenadinesSub-Saharan Africa Sub-Saharan Africa (excluding high income)Sub-Saharan Africa (IDA & IBRD countries)SudanSurinameSwazilandSwedenSwitzerlandSyrian Arab RepublicTajikistanTanzaniaThailandTimor-LesteTogoTongaTrinidad and TobagoTunisiaTurkeyTurkmenistanUkraineUnited Arab EmiratesUnited KingdomUnited StatesUpper middle incomeUruguayUzbekistanVanuatuVenezuela, RBVietnamWorldYemen, Rep.ZambiaZimbabwe Timeline:
This timeline shows a graph from 1961 to 2015 of Germany. No data until 1960. Number of actual observations by date: 55.
Source name:
World Development Indicators
Source organization:
IEA Statistics © OECD/IEA 2014 (http://www.iea.org/stats/index.asp), subject to https://www.iea.org/t&c/termsandconditions/
Categories, topics:
Energy & Mining, Climate Change
Last updated:
apr 23, 2017
Indicators value changes by year
Minimum:
1.953K
jan 1, 1961
Maximum:
4.685K
jan 1, 1980
At the date of observation
Value
Absolute change
Change from previous value
jan 1, 1961
1.953K
+1.953K
0.0%
jan 1, 1962
1.994K
+41.736
2.14%
jan 1, 1963
2.125K
+130.524
6.54%
jan 1, 1964
2.281K
+156.441
7.36%
jan 1, 1965
2.341K
+59.856
2.62%
jan 1, 1966
2.378K
+37.193
1.59%
jan 1, 1967
2.388K
+9.345
0.39%
jan 1, 1968
2.388K
+0.727
0.03%
jan 1, 1969
2.562K
+173.11
7.25%
jan 1, 1970
2.772K
+210.488
8.22%
jan 1, 1971
3.861K
+1.089K
39.28%
jan 1, 1972
3.895K
+34.4
0.89%
jan 1, 1973
4.017K
+122.073
3.13%
jan 1, 1974
4.24K
+222.724
5.54%
jan 1, 1975
4.158K
-81.79
-1.93%
jan 1, 1976
3.985K
-173.297
-4.17%
jan 1, 1977
4.315K
+329.607
8.27%
jan 1, 1978
4.336K
+21.506
0.5%
jan 1, 1979
4.484K
+147.793
3.41%
jan 1, 1980
4.685K
+201.416
4.49%
jan 1, 1981
4.562K
-123.001
-2.63%
jan 1, 1982
4.399K
-162.796
-3.57%
jan 1, 1983
4.258K
-141.635
-3.22%
jan 1, 1984
4.268K
+10.185
0.24%
jan 1, 1985
4.447K
+179.268
4.2%
jan 1, 1986
4.598K
+150.822
3.39%
jan 1, 1987
4.589K
-8.985
-0.2%
jan 1, 1988
4.616K
+27.243
0.59%
jan 1, 1989
4.629K
+12.781
0.28%
jan 1, 1990
4.515K
-114.473
-2.47%
jan 1, 1991
4.421K
-93.34
-2.07%
jan 1, 1992
4.303K
-118.473
-2.68%
jan 1, 1993
4.191K
-111.907
-2.6%
jan 1, 1994
4.123K
-68.288
-1.63%
jan 1, 1995
4.089K
-33.898
-0.82%
jan 1, 1996
4.12K
+30.891
0.76%
jan 1, 1997
4.247K
+126.864
3.08%
jan 1, 1998
4.203K
-43.196
-1.02%
jan 1, 1999
4.177K
-26.063
-0.62%
jan 1, 2000
4.08K
-97.361
-2.33%
jan 1, 2001
4.094K
+14.127
0.35%
jan 1, 2002
4.21K
+115.736
2.83%
jan 1, 2003
4.108K
-101.395
-2.41%
jan 1, 2004
4.085K
-23.898
-0.58%
jan 1, 2005
4.114K
+29.903
0.73%
jan 1, 2006
4.087K
-27.79
-0.68%
jan 1, 2007
4.205K
+118.182
2.89%
jan 1, 2008
3.986K
-218.99
-5.21%
jan 1, 2009
4.037K
+51.02
1.28%
jan 1, 2010
3.79K
-246.358
-6.1%
jan 1, 2011
3.997K
+206.577
5.45%
jan 1, 2012
3.798K
-199.269
-4.99%
jan 1, 2013
3.877K
+79.17
2.08%
jan 1, 2014
3.868K
-9.326
-0.24%
jan 1, 2015
3.749K
-118.516
-3.06%
Ranking of countries by current statistics by years


Comments: