29
/
en
AIzaSyAYiBZKx7MnpbEhh9jyipgxe19OcubqV5w
April 1, 2024
158382
Iraq
IRQ
true
2
1
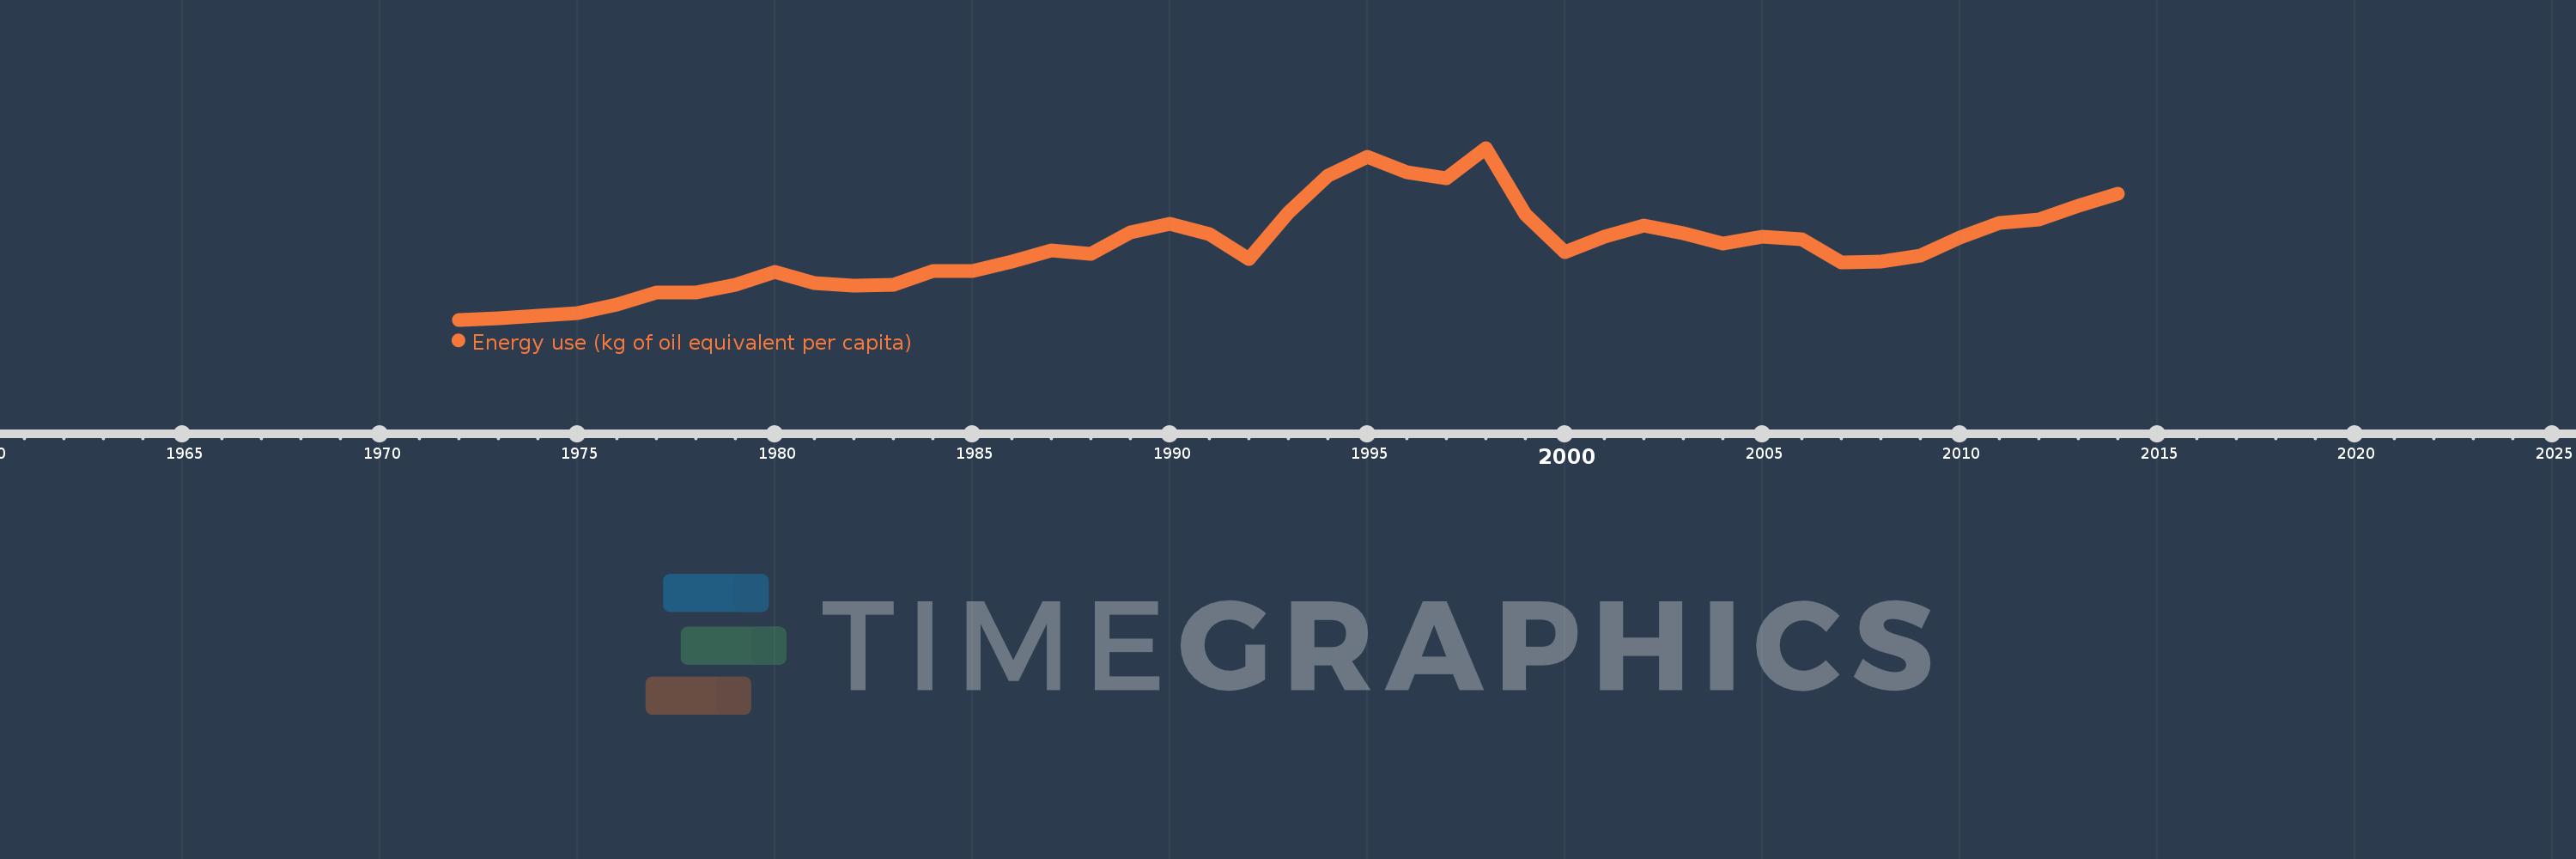
Energy use (kg of oil equivalent per capita)
2014,2013,2012,2011,2010,2009,2008,2007,2006,2005,2004,2003,2002,2001,2000,1999,1998,1997,1996,1995,1994,1993,1992,1991,1990,1989,1988,1987,1986,1985,1984,1983,1982,1981,1980,1979,1978,1977,1976,1975,1974,1973,1972
This statistics in other country:
AlbaniaAlgeriaAngolaAntigua and BarbudaArab WorldArgentinaArmeniaAustraliaAustriaAzerbaijanBahamas, TheBahrainBangladeshBarbadosBelarusBelgiumBelizeBeninBhutanBoliviaBosnia and HerzegovinaBotswanaBrazilBrunei DarussalamBulgariaCabo VerdeCambodiaCameroonCanadaCaribbean small statesCentral Europe and the BalticsChileChinaColombiaComorosCongo, Dem. Rep.Congo, Rep.Costa RicaCote d'IvoireCroatiaCubaCuracaoCyprusCzech RepublicDenmarkDjiboutiDominicaDominican RepublicEarly-demographic dividendEast Asia & PacificEast Asia & Pacific (excluding high income)East Asia & Pacific (IDA & IBRD countries)EcuadorEgypt, Arab Rep.El SalvadorEquatorial GuineaEritreaEstoniaEthiopiaEuro areaEurope & Central AsiaEurope & Central Asia (excluding high income)Europe & Central Asia (IDA & IBRD countries)European UnionFijiFinlandFragile and conflict affected situationsFranceGabonGambia, TheGeorgiaGermanyGhanaGibraltarGreeceGrenadaGuatemalaGuinea-BissauGuyanaHaitiHeavily indebted poor countries (HIPC)High incomeHondurasHong Kong SAR, ChinaHungaryIBRD onlyIcelandIDA & IBRD totalIDA blendIDA onlyIDA totalIndiaIndonesiaIran, Islamic Rep.IraqIrelandIsraelItalyJamaicaJapanJordanKazakhstanKenyaKiribatiKorea, Dem. People’s Rep.Korea, Rep.KosovoKuwaitKyrgyz RepublicLate-demographic dividendLatin America & Caribbean Latin America & Caribbean (excluding high income)Latin America & the Caribbean (IDA & IBRD countries)LatviaLeast developed countries: UN classificationLebanonLesothoLibyaLithuaniaLow & middle incomeLower middle incomeLuxembourgMacedonia, FYRMalaysiaMaldivesMaltaMarshall IslandsMauritiusMexicoMiddle East & North AfricaMiddle East & North Africa (excluding high income)Middle East & North Africa (IDA & IBRD countries)Middle incomeMoldovaMongoliaMontenegroMoroccoMozambiqueMyanmarNamibiaNepalNetherlandsNew ZealandNicaraguaNigerNigeriaNorth AmericaNorwayOECD membersOmanOther small statesPacific island small statesPakistanPalauPanamaParaguayPeruPhilippinesPolandPortugalPost-demographic dividendPre-demographic dividendQatarRomaniaRussian FederationSamoaSao Tome and PrincipeSaudi ArabiaSenegalSerbiaSeychellesSingaporeSlovak RepublicSloveniaSmall statesSolomon IslandsSouth AfricaSouth AsiaSouth Asia (IDA & IBRD)South SudanSpainSri LankaSt. Kitts and NevisSt. LuciaSt. Vincent and the GrenadinesSub-Saharan Africa Sub-Saharan Africa (excluding high income)Sub-Saharan Africa (IDA & IBRD countries)SudanSurinameSwazilandSwedenSwitzerlandSyrian Arab RepublicTajikistanTanzaniaThailandTimor-LesteTogoTongaTrinidad and TobagoTunisiaTurkeyTurkmenistanUkraineUnited Arab EmiratesUnited KingdomUnited StatesUpper middle incomeUruguayUzbekistanVanuatuVenezuela, RBVietnamWorldYemen, Rep.ZambiaZimbabwe Timeline:
This timeline shows a graph from 1972 to 2014 of Iraq. No data until 1971. Number of actual observations by date: 43.
Source name:
World Development Indicators
Source organization:
IEA Statistics © OECD/IEA 2014 (http://www.iea.org/stats/index.asp), subject to https://www.iea.org/t&c/termsandconditions/
Categories, topics:
Energy & Mining, Climate Change
Last updated:
apr 23, 2017
Indicators value changes by year
Minimum:
392.171
jan 1, 1972
Maximum:
1.862K
jan 1, 1998
At the date of observation
Value
Absolute change
Change from previous value
jan 1, 1972
392.171
+392.171
0.0%
jan 1, 1973
405.152
+12.982
3.31%
jan 1, 1974
425.496
+20.343
5.02%
jan 1, 1975
447.786
+22.29
5.24%
jan 1, 1976
521.744
+73.958
16.52%
jan 1, 1977
624.936
+103.192
19.78%
jan 1, 1978
626.355
+1.419
0.23%
jan 1, 1979
691.439
+65.084
10.39%
jan 1, 1980
799.489
+108.05
15.63%
jan 1, 1981
706.065
-93.424
-11.69%
jan 1, 1982
682.12
-23.945
-3.39%
jan 1, 1983
690.324
+8.203
1.2%
jan 1, 1984
810.721
+120.397
17.44%
jan 1, 1985
806.113
-4.608
-0.57%
jan 1, 1986
887.125
+81.012
10.05%
jan 1, 1987
983.161
+96.035
10.83%
jan 1, 1988
958.189
-24.971
-2.54%
jan 1, 1989
1.136K
+178.116
18.59%
jan 1, 1990
1.212K
+75.833
6.67%
jan 1, 1991
1.128K
-84.158
-6.94%
jan 1, 1992
914.323
-213.659
-18.94%
jan 1, 1993
1.311K
+396.866
43.41%
jan 1, 1994
1.622K
+311.03
23.72%
jan 1, 1995
1.783K
+160.95
9.92%
jan 1, 1996
1.657K
-126.56
-7.1%
jan 1, 1997
1.602K
-54.463
-3.29%
jan 1, 1998
1.862K
+259.651
16.21%
jan 1, 1999
1.293K
-569.259
-30.58%
jan 1, 2000
969.95
-322.587
-24.96%
jan 1, 2001
1.106K
+136.021
14.02%
jan 1, 2002
1.2K
+94.48
8.54%
jan 1, 2003
1.131K
-69.507
-5.79%
jan 1, 2004
1.047K
-83.893
-7.42%
jan 1, 2005
1.104K
+56.686
5.41%
jan 1, 2006
1.08K
-23.871
-2.16%
jan 1, 2007
878.685
-201.179
-18.63%
jan 1, 2008
892.396
+13.71
1.56%
jan 1, 2009
942.286
+49.89
5.59%
jan 1, 2010
1.099K
+156.663
16.63%
jan 1, 2011
1.217K
+117.929
10.73%
jan 1, 2012
1.251K
+34.542
2.84%
jan 1, 2013
1.364K
+112.813
9.01%
jan 1, 2014
1.467K
+102.375
7.5%
Ranking of countries by current statistics by years


Comments: