29
/
en
AIzaSyAYiBZKx7MnpbEhh9jyipgxe19OcubqV5w
April 1, 2024
285808
Zambia
ZMB
true
2
1
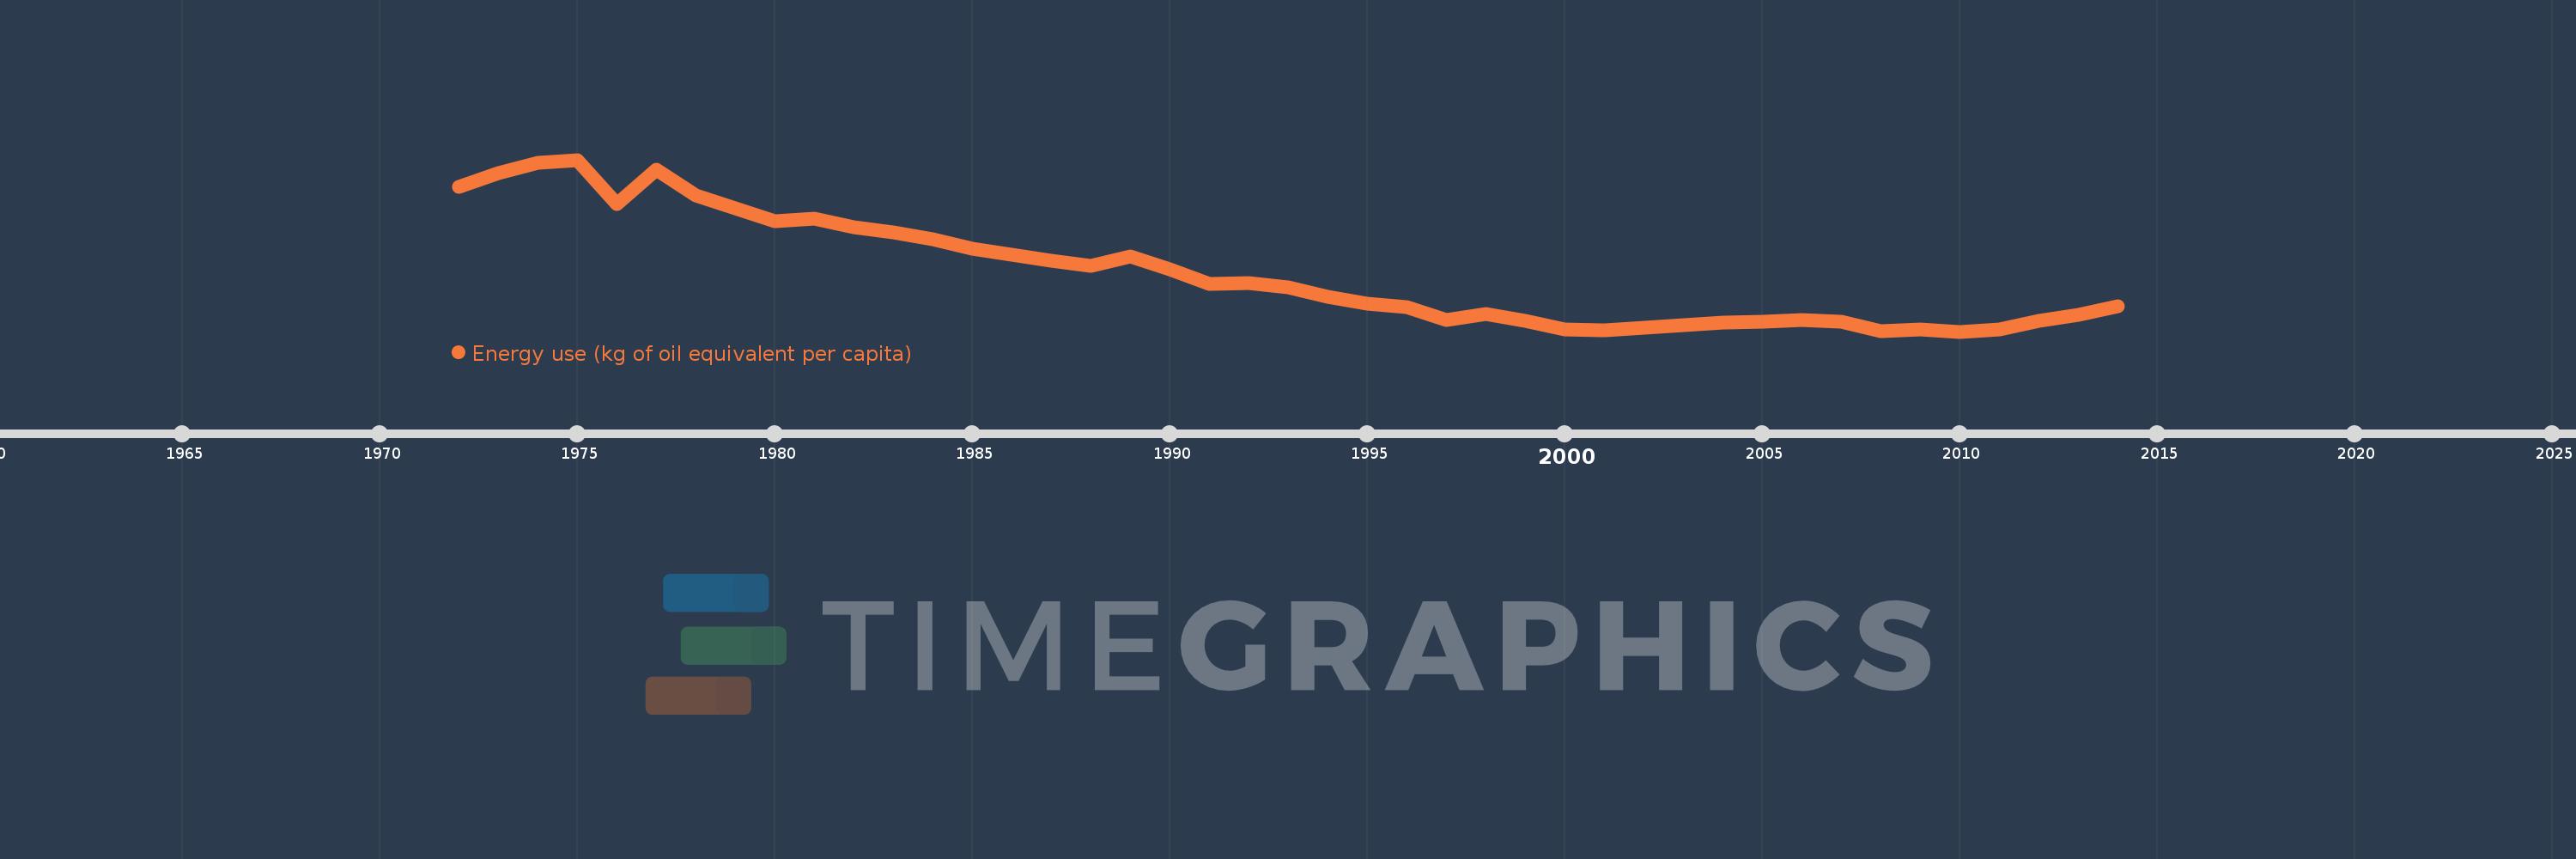
Energy use (kg of oil equivalent per capita)
2014,2013,2012,2011,2010,2009,2008,2007,2006,2005,2004,2003,2002,2001,2000,1999,1998,1997,1996,1995,1994,1993,1992,1991,1990,1989,1988,1987,1986,1985,1984,1983,1982,1981,1980,1979,1978,1977,1976,1975,1974,1973,1972
This statistics in other country:
AlbaniaAlgeriaAngolaAntigua and BarbudaArab WorldArgentinaArmeniaAustraliaAustriaAzerbaijanBahamas, TheBahrainBangladeshBarbadosBelarusBelgiumBelizeBeninBhutanBoliviaBosnia and HerzegovinaBotswanaBrazilBrunei DarussalamBulgariaCabo VerdeCambodiaCameroonCanadaCaribbean small statesCentral Europe and the BalticsChileChinaColombiaComorosCongo, Dem. Rep.Congo, Rep.Costa RicaCote d'IvoireCroatiaCubaCuracaoCyprusCzech RepublicDenmarkDjiboutiDominicaDominican RepublicEarly-demographic dividendEast Asia & PacificEast Asia & Pacific (excluding high income)East Asia & Pacific (IDA & IBRD countries)EcuadorEgypt, Arab Rep.El SalvadorEquatorial GuineaEritreaEstoniaEthiopiaEuro areaEurope & Central AsiaEurope & Central Asia (excluding high income)Europe & Central Asia (IDA & IBRD countries)European UnionFijiFinlandFragile and conflict affected situationsFranceGabonGambia, TheGeorgiaGermanyGhanaGibraltarGreeceGrenadaGuatemalaGuinea-BissauGuyanaHaitiHeavily indebted poor countries (HIPC)High incomeHondurasHong Kong SAR, ChinaHungaryIBRD onlyIcelandIDA & IBRD totalIDA blendIDA onlyIDA totalIndiaIndonesiaIran, Islamic Rep.IraqIrelandIsraelItalyJamaicaJapanJordanKazakhstanKenyaKiribatiKorea, Dem. People’s Rep.Korea, Rep.KosovoKuwaitKyrgyz RepublicLate-demographic dividendLatin America & Caribbean Latin America & Caribbean (excluding high income)Latin America & the Caribbean (IDA & IBRD countries)LatviaLeast developed countries: UN classificationLebanonLesothoLibyaLithuaniaLow & middle incomeLower middle incomeLuxembourgMacedonia, FYRMalaysiaMaldivesMaltaMarshall IslandsMauritiusMexicoMiddle East & North AfricaMiddle East & North Africa (excluding high income)Middle East & North Africa (IDA & IBRD countries)Middle incomeMoldovaMongoliaMontenegroMoroccoMozambiqueMyanmarNamibiaNepalNetherlandsNew ZealandNicaraguaNigerNigeriaNorth AmericaNorwayOECD membersOmanOther small statesPacific island small statesPakistanPalauPanamaParaguayPeruPhilippinesPolandPortugalPost-demographic dividendPre-demographic dividendQatarRomaniaRussian FederationSamoaSao Tome and PrincipeSaudi ArabiaSenegalSerbiaSeychellesSingaporeSlovak RepublicSloveniaSmall statesSolomon IslandsSouth AfricaSouth AsiaSouth Asia (IDA & IBRD)South SudanSpainSri LankaSt. Kitts and NevisSt. LuciaSt. Vincent and the GrenadinesSub-Saharan Africa Sub-Saharan Africa (excluding high income)Sub-Saharan Africa (IDA & IBRD countries)SudanSurinameSwazilandSwedenSwitzerlandSyrian Arab RepublicTajikistanTanzaniaThailandTimor-LesteTogoTongaTrinidad and TobagoTunisiaTurkeyTurkmenistanUkraineUnited Arab EmiratesUnited KingdomUnited StatesUpper middle incomeUruguayUzbekistanVanuatuVenezuela, RBVietnamWorldYemen, Rep.ZambiaZimbabwe Timeline:
This timeline shows a graph from 1972 to 2014 of Zambia. No data until 1971. Number of actual observations by date: 43.
Source name:
World Development Indicators
Source organization:
IEA Statistics © OECD/IEA 2014 (http://www.iea.org/stats/index.asp), subject to https://www.iea.org/t&c/termsandconditions/
Categories, topics:
Energy & Mining, Climate Change
Last updated:
apr 23, 2017
Indicators value changes by year
Minimum:
587.788
jan 1, 2010
Maximum:
879.662
jan 1, 1975
At the date of observation
Value
Absolute change
Change from previous value
jan 1, 1972
833.592
+833.592
0.0%
jan 1, 1973
857.093
+23.501
2.82%
jan 1, 1974
874.861
+17.768
2.07%
jan 1, 1975
879.662
+4.8
0.55%
jan 1, 1976
803.904
-75.758
-8.61%
jan 1, 1977
862.563
+58.659
7.3%
jan 1, 1978
819.787
-42.775
-4.96%
jan 1, 1979
797.838
-21.949
-2.68%
jan 1, 1980
775.449
-22.39
-2.81%
jan 1, 1981
779.796
+4.347
0.56%
jan 1, 1982
764.672
-15.123
-1.94%
jan 1, 1983
756.612
-8.06
-1.05%
jan 1, 1984
744.025
-12.587
-1.66%
jan 1, 1985
728.888
-15.137
-2.03%
jan 1, 1986
718.7
-10.187
-1.4%
jan 1, 1987
707.52
-11.181
-1.56%
jan 1, 1988
700.141
-7.379
-1.04%
jan 1, 1989
714.846
+14.705
2.1%
jan 1, 1990
693.563
-21.283
-2.98%
jan 1, 1991
669.191
-24.372
-3.51%
jan 1, 1992
669.69
+0.5
0.07%
jan 1, 1993
662.722
-6.969
-1.04%
jan 1, 1994
647.035
-15.687
-2.37%
jan 1, 1995
635.331
-11.704
-1.81%
jan 1, 1996
629.813
-5.517
-0.87%
jan 1, 1997
608.1
-21.713
-3.45%
jan 1, 1998
617.209
+9.109
1.5%
jan 1, 1999
606.506
-10.703
-1.73%
jan 1, 2000
591.354
-15.152
-2.5%
jan 1, 2001
590.438
-0.916
-0.15%
jan 1, 2002
593.693
+3.254
0.55%
jan 1, 2003
598.548
+4.856
0.82%
jan 1, 2004
602.964
+4.416
0.74%
jan 1, 2005
604.494
+1.53
0.25%
jan 1, 2006
608.102
+3.608
0.6%
jan 1, 2007
604.774
-3.328
-0.55%
jan 1, 2008
588.019
-16.755
-2.77%
jan 1, 2009
590.994
+2.975
0.51%
jan 1, 2010
587.788
-3.207
-0.54%
jan 1, 2011
590.88
+3.092
0.53%
jan 1, 2012
605.568
+14.688
2.49%
jan 1, 2013
616.628
+11.06
1.83%
jan 1, 2014
631.459
+14.831
2.41%
Ranking of countries by current statistics by years


Comments: