29
/
en
AIzaSyAYiBZKx7MnpbEhh9jyipgxe19OcubqV5w
April 1, 2024
212871
Nigeria
NGA
true
2
1
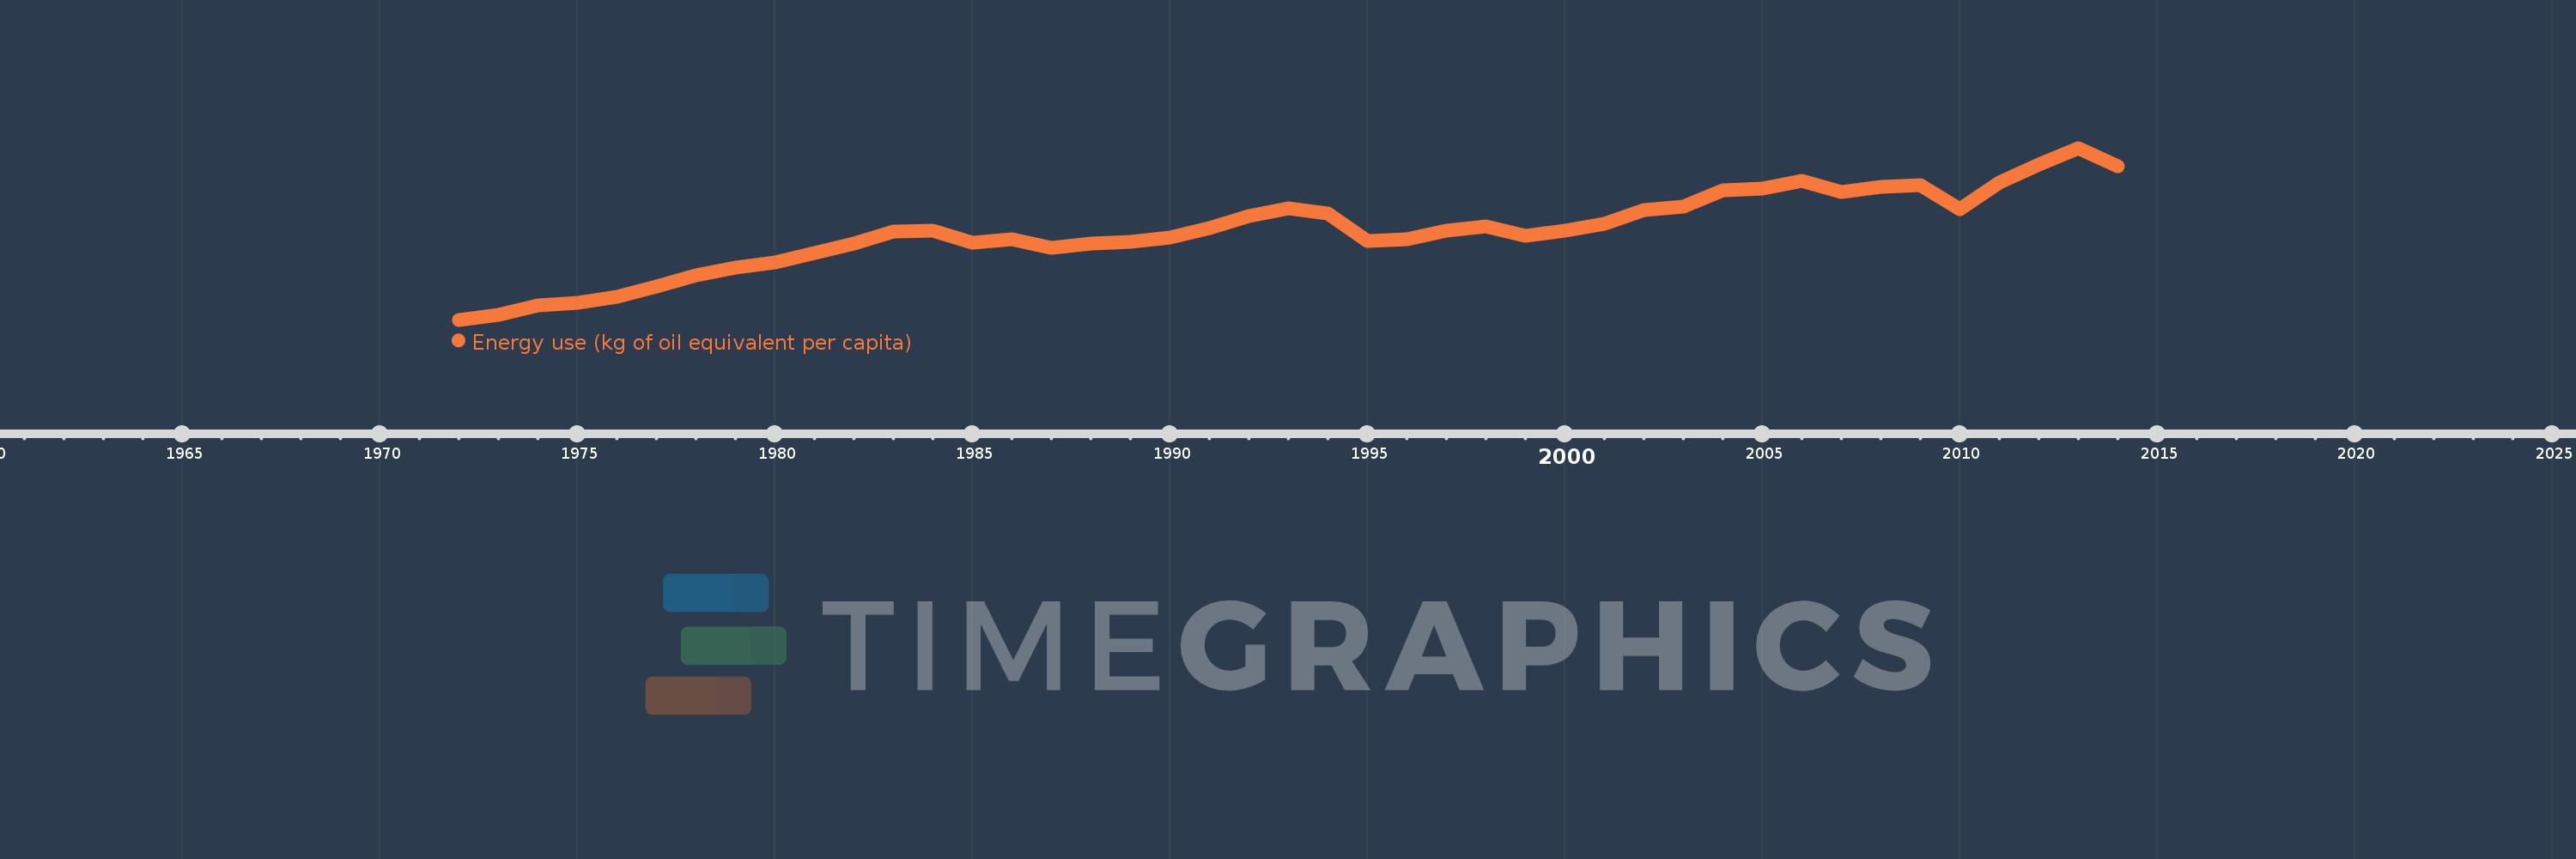
Energy use (kg of oil equivalent per capita)
2014,2013,2012,2011,2010,2009,2008,2007,2006,2005,2004,2003,2002,2001,2000,1999,1998,1997,1996,1995,1994,1993,1992,1991,1990,1989,1988,1987,1986,1985,1984,1983,1982,1981,1980,1979,1978,1977,1976,1975,1974,1973,1972
This statistics in other country:
AlbaniaAlgeriaAngolaAntigua and BarbudaArab WorldArgentinaArmeniaAustraliaAustriaAzerbaijanBahamas, TheBahrainBangladeshBarbadosBelarusBelgiumBelizeBeninBhutanBoliviaBosnia and HerzegovinaBotswanaBrazilBrunei DarussalamBulgariaCabo VerdeCambodiaCameroonCanadaCaribbean small statesCentral Europe and the BalticsChileChinaColombiaComorosCongo, Dem. Rep.Congo, Rep.Costa RicaCote d'IvoireCroatiaCubaCuracaoCyprusCzech RepublicDenmarkDjiboutiDominicaDominican RepublicEarly-demographic dividendEast Asia & PacificEast Asia & Pacific (excluding high income)East Asia & Pacific (IDA & IBRD countries)EcuadorEgypt, Arab Rep.El SalvadorEquatorial GuineaEritreaEstoniaEthiopiaEuro areaEurope & Central AsiaEurope & Central Asia (excluding high income)Europe & Central Asia (IDA & IBRD countries)European UnionFijiFinlandFragile and conflict affected situationsFranceGabonGambia, TheGeorgiaGermanyGhanaGibraltarGreeceGrenadaGuatemalaGuinea-BissauGuyanaHaitiHeavily indebted poor countries (HIPC)High incomeHondurasHong Kong SAR, ChinaHungaryIBRD onlyIcelandIDA & IBRD totalIDA blendIDA onlyIDA totalIndiaIndonesiaIran, Islamic Rep.IraqIrelandIsraelItalyJamaicaJapanJordanKazakhstanKenyaKiribatiKorea, Dem. People’s Rep.Korea, Rep.KosovoKuwaitKyrgyz RepublicLate-demographic dividendLatin America & Caribbean Latin America & Caribbean (excluding high income)Latin America & the Caribbean (IDA & IBRD countries)LatviaLeast developed countries: UN classificationLebanonLesothoLibyaLithuaniaLow & middle incomeLower middle incomeLuxembourgMacedonia, FYRMalaysiaMaldivesMaltaMarshall IslandsMauritiusMexicoMiddle East & North AfricaMiddle East & North Africa (excluding high income)Middle East & North Africa (IDA & IBRD countries)Middle incomeMoldovaMongoliaMontenegroMoroccoMozambiqueMyanmarNamibiaNepalNetherlandsNew ZealandNicaraguaNigerNigeriaNorth AmericaNorwayOECD membersOmanOther small statesPacific island small statesPakistanPalauPanamaParaguayPeruPhilippinesPolandPortugalPost-demographic dividendPre-demographic dividendQatarRomaniaRussian FederationSamoaSao Tome and PrincipeSaudi ArabiaSenegalSerbiaSeychellesSingaporeSlovak RepublicSloveniaSmall statesSolomon IslandsSouth AfricaSouth AsiaSouth Asia (IDA & IBRD)South SudanSpainSri LankaSt. Kitts and NevisSt. LuciaSt. Vincent and the GrenadinesSub-Saharan Africa Sub-Saharan Africa (excluding high income)Sub-Saharan Africa (IDA & IBRD countries)SudanSurinameSwazilandSwedenSwitzerlandSyrian Arab RepublicTajikistanTanzaniaThailandTimor-LesteTogoTongaTrinidad and TobagoTunisiaTurkeyTurkmenistanUkraineUnited Arab EmiratesUnited KingdomUnited StatesUpper middle incomeUruguayUzbekistanVanuatuVenezuela, RBVietnamWorldYemen, Rep.ZambiaZimbabwe Timeline:
This timeline shows a graph from 1972 to 2014 of Nigeria. No data until 1971. Number of actual observations by date: 43.
Source name:
World Development Indicators
Source organization:
IEA Statistics © OECD/IEA 2014 (http://www.iea.org/stats/index.asp), subject to https://www.iea.org/t&c/termsandconditions/
Categories, topics:
Energy & Mining, Climate Change
Last updated:
apr 23, 2017
Indicators value changes by year
Minimum:
577.499
jan 1, 1972
Maximum:
796.633
jan 1, 2013
At the date of observation
Value
Absolute change
Change from previous value
jan 1, 1972
577.499
+577.499
0.0%
jan 1, 1973
583.795
+6.296
1.09%
jan 1, 1974
595.405
+11.61
1.99%
jan 1, 1975
598.646
+3.241
0.54%
jan 1, 1976
606.618
+7.972
1.33%
jan 1, 1977
620.382
+13.765
2.27%
jan 1, 1978
634.259
+13.876
2.24%
jan 1, 1979
643.86
+9.602
1.51%
jan 1, 1980
651.085
+7.225
1.12%
jan 1, 1981
662.958
+11.873
1.82%
jan 1, 1982
674.181
+11.223
1.69%
jan 1, 1983
689.495
+15.314
2.27%
jan 1, 1984
691.233
+1.739
0.25%
jan 1, 1985
675.465
-15.768
-2.28%
jan 1, 1986
680.473
+5.008
0.74%
jan 1, 1987
669.163
-11.31
-1.66%
jan 1, 1988
674.473
+5.31
0.79%
jan 1, 1989
676.438
+1.965
0.29%
jan 1, 1990
681.985
+5.547
0.82%
jan 1, 1991
694.659
+12.675
1.86%
jan 1, 1992
709.64
+14.981
2.16%
jan 1, 1993
719.308
+9.668
1.36%
jan 1, 1994
712.779
-6.53
-0.91%
jan 1, 1995
678.153
-34.626
-4.86%
jan 1, 1996
679.669
+1.516
0.22%
jan 1, 1997
691.087
+11.418
1.68%
jan 1, 1998
696.885
+5.798
0.84%
jan 1, 1999
684.341
-12.544
-1.8%
jan 1, 2000
691.295
+6.954
1.02%
jan 1, 2001
700.242
+8.947
1.29%
jan 1, 2002
716.872
+16.63
2.37%
jan 1, 2003
721.312
+4.44
0.62%
jan 1, 2004
743.111
+21.799
3.02%
jan 1, 2005
744.746
+1.634
0.22%
jan 1, 2006
754.256
+9.511
1.28%
jan 1, 2007
740.882
-13.375
-1.77%
jan 1, 2008
747.101
+6.219
0.84%
jan 1, 2009
749.218
+2.117
0.28%
jan 1, 2010
718.054
-31.164
-4.16%
jan 1, 2011
752.517
+34.463
4.8%
jan 1, 2012
775.038
+22.521
2.99%
jan 1, 2013
796.633
+21.594
2.79%
jan 1, 2014
773.021
-23.611
-2.96%
Ranking of countries by current statistics by years


Comments: