29
/
en
AIzaSyAYiBZKx7MnpbEhh9jyipgxe19OcubqV5w
April 1, 2024
220742
Paraguay
PRY
true
2
1
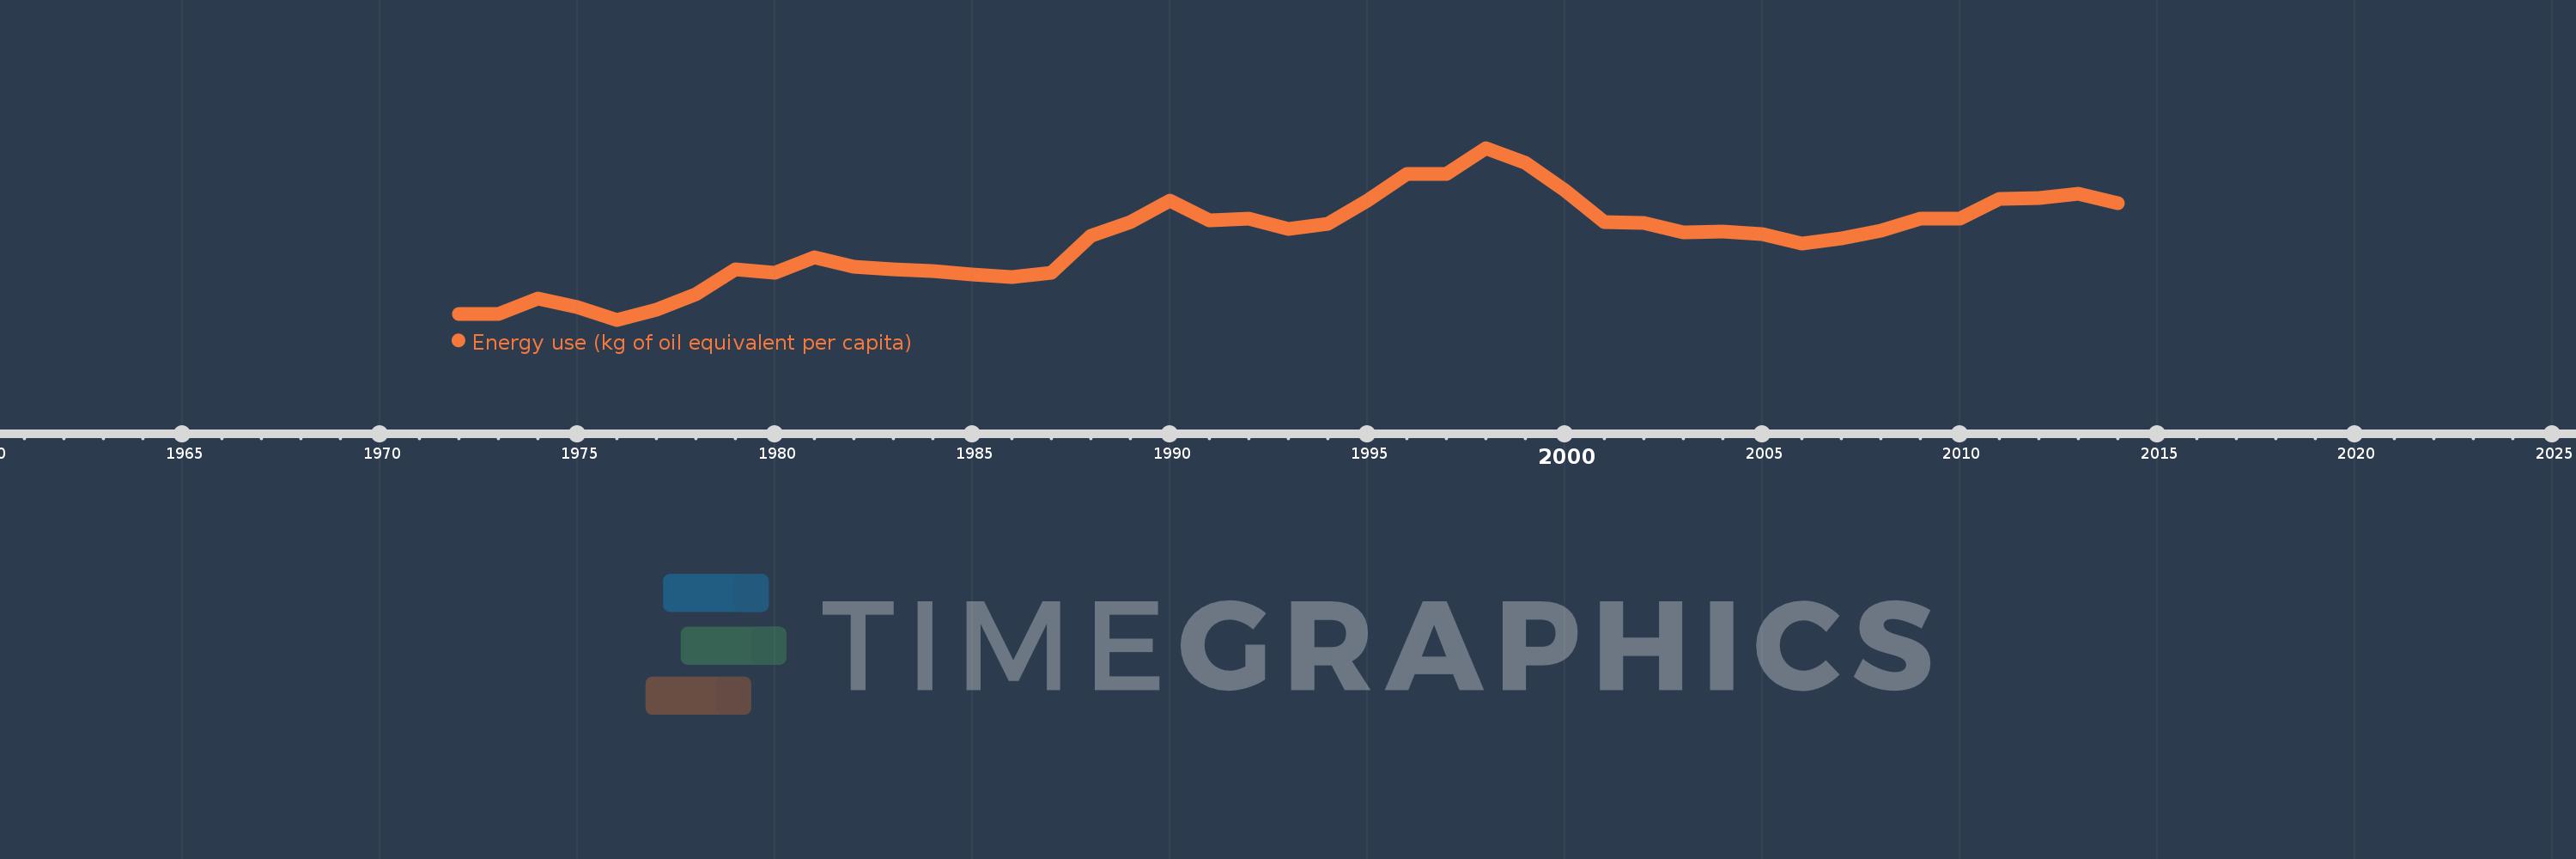
Energy use (kg of oil equivalent per capita)
2014,2013,2012,2011,2010,2009,2008,2007,2006,2005,2004,2003,2002,2001,2000,1999,1998,1997,1996,1995,1994,1993,1992,1991,1990,1989,1988,1987,1986,1985,1984,1983,1982,1981,1980,1979,1978,1977,1976,1975,1974,1973,1972
This statistics in other country:
AlbaniaAlgeriaAngolaAntigua and BarbudaArab WorldArgentinaArmeniaAustraliaAustriaAzerbaijanBahamas, TheBahrainBangladeshBarbadosBelarusBelgiumBelizeBeninBhutanBoliviaBosnia and HerzegovinaBotswanaBrazilBrunei DarussalamBulgariaCabo VerdeCambodiaCameroonCanadaCaribbean small statesCentral Europe and the BalticsChileChinaColombiaComorosCongo, Dem. Rep.Congo, Rep.Costa RicaCote d'IvoireCroatiaCubaCuracaoCyprusCzech RepublicDenmarkDjiboutiDominicaDominican RepublicEarly-demographic dividendEast Asia & PacificEast Asia & Pacific (excluding high income)East Asia & Pacific (IDA & IBRD countries)EcuadorEgypt, Arab Rep.El SalvadorEquatorial GuineaEritreaEstoniaEthiopiaEuro areaEurope & Central AsiaEurope & Central Asia (excluding high income)Europe & Central Asia (IDA & IBRD countries)European UnionFijiFinlandFragile and conflict affected situationsFranceGabonGambia, TheGeorgiaGermanyGhanaGibraltarGreeceGrenadaGuatemalaGuinea-BissauGuyanaHaitiHeavily indebted poor countries (HIPC)High incomeHondurasHong Kong SAR, ChinaHungaryIBRD onlyIcelandIDA & IBRD totalIDA blendIDA onlyIDA totalIndiaIndonesiaIran, Islamic Rep.IraqIrelandIsraelItalyJamaicaJapanJordanKazakhstanKenyaKiribatiKorea, Dem. People’s Rep.Korea, Rep.KosovoKuwaitKyrgyz RepublicLate-demographic dividendLatin America & Caribbean Latin America & Caribbean (excluding high income)Latin America & the Caribbean (IDA & IBRD countries)LatviaLeast developed countries: UN classificationLebanonLesothoLibyaLithuaniaLow & middle incomeLower middle incomeLuxembourgMacedonia, FYRMalaysiaMaldivesMaltaMarshall IslandsMauritiusMexicoMiddle East & North AfricaMiddle East & North Africa (excluding high income)Middle East & North Africa (IDA & IBRD countries)Middle incomeMoldovaMongoliaMontenegroMoroccoMozambiqueMyanmarNamibiaNepalNetherlandsNew ZealandNicaraguaNigerNigeriaNorth AmericaNorwayOECD membersOmanOther small statesPacific island small statesPakistanPalauPanamaParaguayPeruPhilippinesPolandPortugalPost-demographic dividendPre-demographic dividendQatarRomaniaRussian FederationSamoaSao Tome and PrincipeSaudi ArabiaSenegalSerbiaSeychellesSingaporeSlovak RepublicSloveniaSmall statesSolomon IslandsSouth AfricaSouth AsiaSouth Asia (IDA & IBRD)South SudanSpainSri LankaSt. Kitts and NevisSt. LuciaSt. Vincent and the GrenadinesSub-Saharan Africa Sub-Saharan Africa (excluding high income)Sub-Saharan Africa (IDA & IBRD countries)SudanSurinameSwazilandSwedenSwitzerlandSyrian Arab RepublicTajikistanTanzaniaThailandTimor-LesteTogoTongaTrinidad and TobagoTunisiaTurkeyTurkmenistanUkraineUnited Arab EmiratesUnited KingdomUnited StatesUpper middle incomeUruguayUzbekistanVanuatuVenezuela, RBVietnamWorldYemen, Rep.ZambiaZimbabwe Timeline:
This timeline shows a graph from 1972 to 2014 of Paraguay. No data until 1971. Number of actual observations by date: 43.
Source name:
World Development Indicators
Source organization:
IEA Statistics © OECD/IEA 2014 (http://www.iea.org/stats/index.asp), subject to https://www.iea.org/t&c/termsandconditions/
Categories, topics:
Energy & Mining, Climate Change
Last updated:
apr 23, 2017
Indicators value changes by year
Minimum:
528.115
jan 1, 1976
Maximum:
877.045
jan 1, 1998
At the date of observation
Value
Absolute change
Change from previous value
jan 1, 1972
539.758
+539.758
0.0%
jan 1, 1973
540.588
+0.83
0.15%
jan 1, 1974
571.377
+30.788
5.7%
jan 1, 1975
553.282
-18.095
-3.17%
jan 1, 1976
528.115
-25.167
-4.55%
jan 1, 1977
547.697
+19.582
3.71%
jan 1, 1978
580.531
+32.834
5.99%
jan 1, 1979
631.203
+50.672
8.73%
jan 1, 1980
623.462
-7.741
-1.23%
jan 1, 1981
655.424
+31.962
5.13%
jan 1, 1982
636.174
-19.25
-2.94%
jan 1, 1983
630.649
-5.525
-0.87%
jan 1, 1984
626.717
-3.931
-0.62%
jan 1, 1985
620.068
-6.65
-1.06%
jan 1, 1986
615.168
-4.9
-0.79%
jan 1, 1987
622.941
+7.773
1.26%
jan 1, 1988
699.103
+76.162
12.23%
jan 1, 1989
726.932
+27.829
3.98%
jan 1, 1990
770.89
+43.959
6.05%
jan 1, 1991
729.22
-41.671
-5.41%
jan 1, 1992
733.726
+4.506
0.62%
jan 1, 1993
712.691
-21.035
-2.87%
jan 1, 1994
722.227
+9.536
1.34%
jan 1, 1995
770.823
+48.595
6.73%
jan 1, 1996
824.558
+53.735
6.97%
jan 1, 1997
824.762
+0.204
0.02%
jan 1, 1998
877.045
+52.283
6.34%
jan 1, 1999
847.184
-29.861
-3.4%
jan 1, 2000
791.646
-55.538
-6.56%
jan 1, 2001
726.27
-65.376
-8.26%
jan 1, 2002
724.963
-1.307
-0.18%
jan 1, 2003
705.434
-19.529
-2.69%
jan 1, 2004
707.147
+1.713
0.24%
jan 1, 2005
701.89
-5.257
-0.74%
jan 1, 2006
683.201
-18.689
-2.66%
jan 1, 2007
693.568
+10.367
1.52%
jan 1, 2008
708.783
+15.215
2.19%
jan 1, 2009
732.882
+24.1
3.4%
jan 1, 2010
732.689
-0.193
-0.03%
jan 1, 2011
774.221
+41.532
5.67%
jan 1, 2012
774.706
+0.485
0.06%
jan 1, 2013
783.335
+8.63
1.11%
jan 1, 2014
764.137
-19.198
-2.45%
Ranking of countries by current statistics by years


Comments: