29
/
en
AIzaSyAYiBZKx7MnpbEhh9jyipgxe19OcubqV5w
April 1, 2024
27228
East Asia & Pacific
EAS
false
2
1
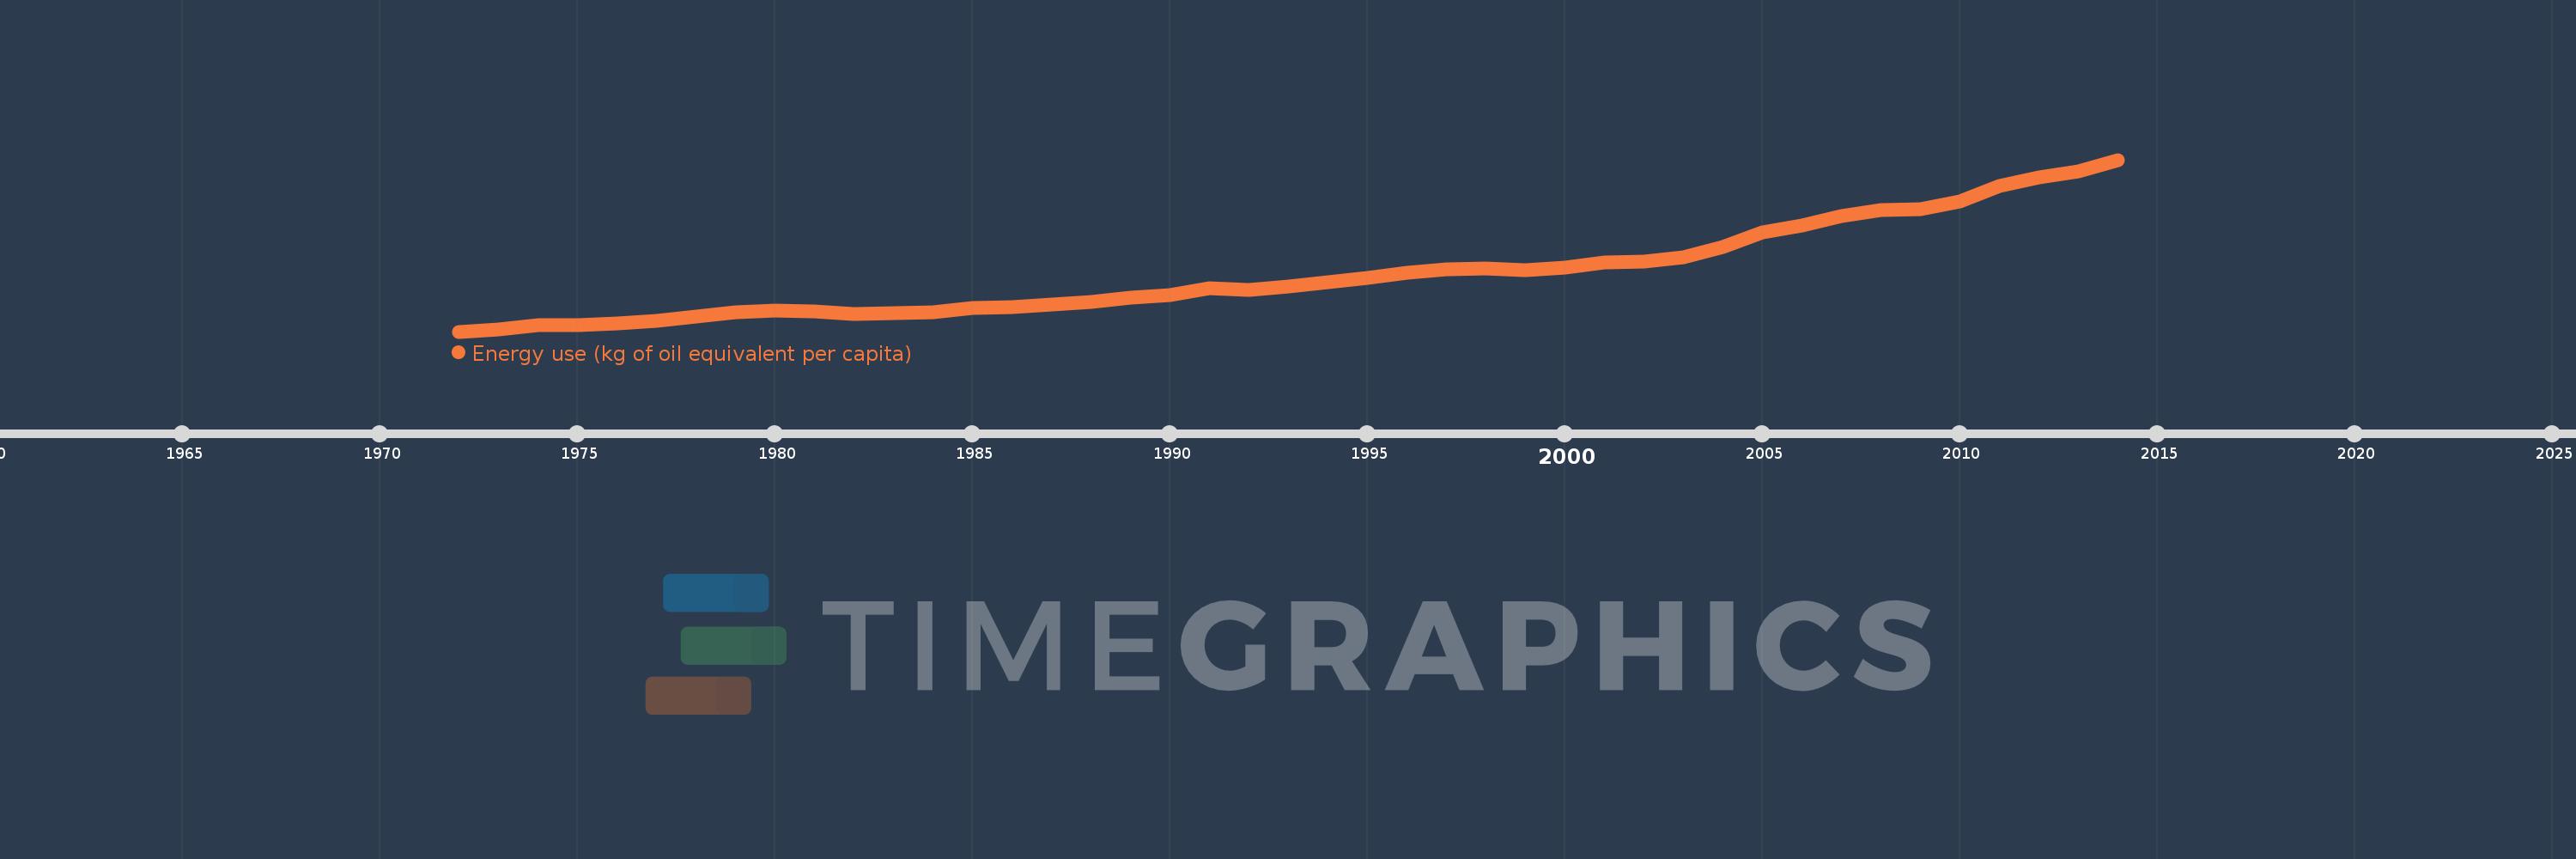
Energy use (kg of oil equivalent per capita)
2014,2013,2012,2011,2010,2009,2008,2007,2006,2005,2004,2003,2002,2001,2000,1999,1998,1997,1996,1995,1994,1993,1992,1991,1990,1989,1988,1987,1986,1985,1984,1983,1982,1981,1980,1979,1978,1977,1976,1975,1974,1973,1972
This statistics in other country:
AlbaniaAlgeriaAngolaAntigua and BarbudaArab WorldArgentinaArmeniaAustraliaAustriaAzerbaijanBahamas, TheBahrainBangladeshBarbadosBelarusBelgiumBelizeBeninBhutanBoliviaBosnia and HerzegovinaBotswanaBrazilBrunei DarussalamBulgariaCabo VerdeCambodiaCameroonCanadaCaribbean small statesCentral Europe and the BalticsChileChinaColombiaComorosCongo, Dem. Rep.Congo, Rep.Costa RicaCote d'IvoireCroatiaCubaCuracaoCyprusCzech RepublicDenmarkDjiboutiDominicaDominican RepublicEarly-demographic dividendEast Asia & PacificEast Asia & Pacific (excluding high income)East Asia & Pacific (IDA & IBRD countries)EcuadorEgypt, Arab Rep.El SalvadorEquatorial GuineaEritreaEstoniaEthiopiaEuro areaEurope & Central AsiaEurope & Central Asia (excluding high income)Europe & Central Asia (IDA & IBRD countries)European UnionFijiFinlandFragile and conflict affected situationsFranceGabonGambia, TheGeorgiaGermanyGhanaGibraltarGreeceGrenadaGuatemalaGuinea-BissauGuyanaHaitiHeavily indebted poor countries (HIPC)High incomeHondurasHong Kong SAR, ChinaHungaryIBRD onlyIcelandIDA & IBRD totalIDA blendIDA onlyIDA totalIndiaIndonesiaIran, Islamic Rep.IraqIrelandIsraelItalyJamaicaJapanJordanKazakhstanKenyaKiribatiKorea, Dem. People’s Rep.Korea, Rep.KosovoKuwaitKyrgyz RepublicLate-demographic dividendLatin America & Caribbean Latin America & Caribbean (excluding high income)Latin America & the Caribbean (IDA & IBRD countries)LatviaLeast developed countries: UN classificationLebanonLesothoLibyaLithuaniaLow & middle incomeLower middle incomeLuxembourgMacedonia, FYRMalaysiaMaldivesMaltaMarshall IslandsMauritiusMexicoMiddle East & North AfricaMiddle East & North Africa (excluding high income)Middle East & North Africa (IDA & IBRD countries)Middle incomeMoldovaMongoliaMontenegroMoroccoMozambiqueMyanmarNamibiaNepalNetherlandsNew ZealandNicaraguaNigerNigeriaNorth AmericaNorwayOECD membersOmanOther small statesPacific island small statesPakistanPalauPanamaParaguayPeruPhilippinesPolandPortugalPost-demographic dividendPre-demographic dividendQatarRomaniaRussian FederationSamoaSao Tome and PrincipeSaudi ArabiaSenegalSerbiaSeychellesSingaporeSlovak RepublicSloveniaSmall statesSolomon IslandsSouth AfricaSouth AsiaSouth Asia (IDA & IBRD)South SudanSpainSri LankaSt. Kitts and NevisSt. LuciaSt. Vincent and the GrenadinesSub-Saharan Africa Sub-Saharan Africa (excluding high income)Sub-Saharan Africa (IDA & IBRD countries)SudanSurinameSwazilandSwedenSwitzerlandSyrian Arab RepublicTajikistanTanzaniaThailandTimor-LesteTogoTongaTrinidad and TobagoTunisiaTurkeyTurkmenistanUkraineUnited Arab EmiratesUnited KingdomUnited StatesUpper middle incomeUruguayUzbekistanVanuatuVenezuela, RBVietnamWorldYemen, Rep.ZambiaZimbabwe Timeline:
This timeline shows a graph from 1972 to 2014 of East Asia & Pacific. No data until 1971. Number of actual observations by date: 43.
Source name:
World Development Indicators
Source organization:
IEA Statistics © OECD/IEA 2014 (http://www.iea.org/stats/index.asp), subject to https://www.iea.org/t&c/termsandconditions/
Categories, topics:
Energy & Mining, Climate Change
Last updated:
apr 23, 2017
Indicators value changes by year
Minimum:
658.479
jan 1, 1972
Maximum:
2.073K
jan 1, 2014
At the date of observation
Value
Absolute change
Change from previous value
jan 1, 1972
658.479
+658.479
0.0%
jan 1, 1973
678.881
+20.402
3.1%
jan 1, 1974
711.373
+32.492
4.79%
jan 1, 1975
711.239
-0.134
-0.02%
jan 1, 1976
724.726
+13.486
1.9%
jan 1, 1977
747.171
+22.445
3.1%
jan 1, 1978
783.648
+36.477
4.88%
jan 1, 1979
815.716
+32.069
4.09%
jan 1, 1980
833.77
+18.053
2.21%
jan 1, 1981
822.742
-11.028
-1.32%
jan 1, 1982
805.162
-17.58
-2.14%
jan 1, 1983
811.513
+6.351
0.79%
jan 1, 1984
820.868
+9.355
1.15%
jan 1, 1985
856.389
+35.521
4.33%
jan 1, 1986
862.572
+6.183
0.72%
jan 1, 1987
880.277
+17.705
2.05%
jan 1, 1988
900.915
+20.638
2.34%
jan 1, 1989
938.186
+37.271
4.14%
jan 1, 1990
955.982
+17.796
1.9%
jan 1, 1991
1.015K
+59.273
6.2%
jan 1, 1992
1.005K
-10.132
-1.0%
jan 1, 1993
1.028K
+22.82
2.27%
jan 1, 1994
1.067K
+38.557
3.75%
jan 1, 1995
1.101K
+34.508
3.24%
jan 1, 1996
1.147K
+45.597
4.14%
jan 1, 1997
1.173K
+26.646
2.32%
jan 1, 1998
1.182K
+8.408
0.72%
jan 1, 1999
1.161K
-20.833
-1.76%
jan 1, 2000
1.183K
+21.917
1.89%
jan 1, 2001
1.23K
+46.788
3.96%
jan 1, 2002
1.235K
+5.316
0.43%
jan 1, 2003
1.273K
+38.191
3.09%
jan 1, 2004
1.358K
+84.764
6.66%
jan 1, 2005
1.476K
+117.808
8.68%
jan 1, 2006
1.532K
+56.719
3.84%
jan 1, 2007
1.607K
+75.1
4.9%
jan 1, 2008
1.657K
+49.39
3.07%
jan 1, 2009
1.67K
+13.308
0.8%
jan 1, 2010
1.729K
+58.825
3.52%
jan 1, 2011
1.855K
+126.536
7.32%
jan 1, 2012
1.926K
+70.786
3.81%
jan 1, 2013
1.977K
+50.894
2.64%
jan 1, 2014
2.073K
+96.286
4.87%
Ranking of countries by current statistics by years


Comments: