29
/
en
AIzaSyAYiBZKx7MnpbEhh9jyipgxe19OcubqV5w
April 1, 2024
40649
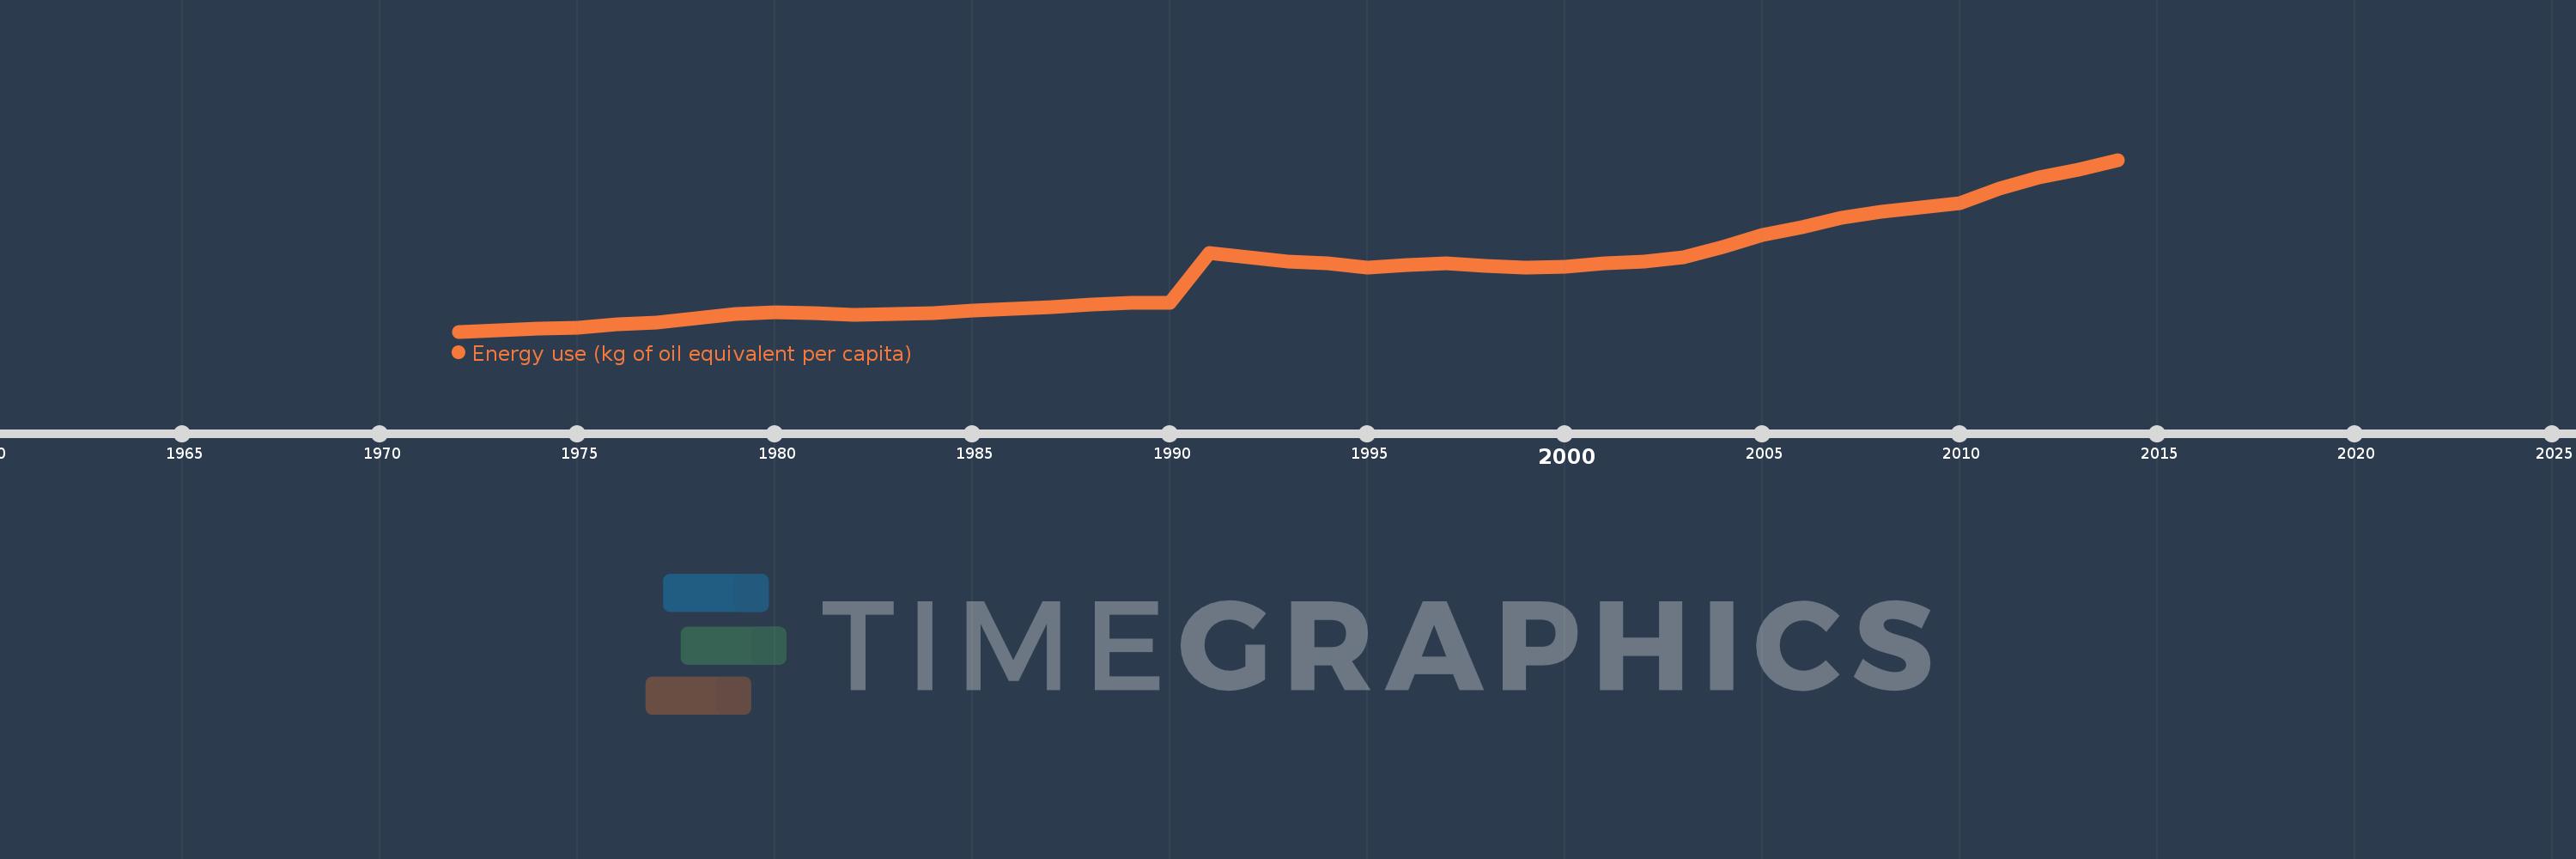
Late-demographic dividend
LTE
false
2
1
Energy use (kg of oil equivalent per capita)
2014,2013,2012,2011,2010,2009,2008,2007,2006,2005,2004,2003,2002,2001,2000,1999,1998,1997,1996,1995,1994,1993,1992,1991,1990,1989,1988,1987,1986,1985,1984,1983,1982,1981,1980,1979,1978,1977,1976,1975,1974,1973,1972
This statistics in other country:
AlbaniaAlgeriaAngolaAntigua and BarbudaArab WorldArgentinaArmeniaAustraliaAustriaAzerbaijanBahamas, TheBahrainBangladeshBarbadosBelarusBelgiumBelizeBeninBhutanBoliviaBosnia and HerzegovinaBotswanaBrazilBrunei DarussalamBulgariaCabo VerdeCambodiaCameroonCanadaCaribbean small statesCentral Europe and the BalticsChileChinaColombiaComorosCongo, Dem. Rep.Congo, Rep.Costa RicaCote d'IvoireCroatiaCubaCuracaoCyprusCzech RepublicDenmarkDjiboutiDominicaDominican RepublicEarly-demographic dividendEast Asia & PacificEast Asia & Pacific (excluding high income)East Asia & Pacific (IDA & IBRD countries)EcuadorEgypt, Arab Rep.El SalvadorEquatorial GuineaEritreaEstoniaEthiopiaEuro areaEurope & Central AsiaEurope & Central Asia (excluding high income)Europe & Central Asia (IDA & IBRD countries)European UnionFijiFinlandFragile and conflict affected situationsFranceGabonGambia, TheGeorgiaGermanyGhanaGibraltarGreeceGrenadaGuatemalaGuinea-BissauGuyanaHaitiHeavily indebted poor countries (HIPC)High incomeHondurasHong Kong SAR, ChinaHungaryIBRD onlyIcelandIDA & IBRD totalIDA blendIDA onlyIDA totalIndiaIndonesiaIran, Islamic Rep.IraqIrelandIsraelItalyJamaicaJapanJordanKazakhstanKenyaKiribatiKorea, Dem. People’s Rep.Korea, Rep.KosovoKuwaitKyrgyz RepublicLate-demographic dividendLatin America & Caribbean Latin America & Caribbean (excluding high income)Latin America & the Caribbean (IDA & IBRD countries)LatviaLeast developed countries: UN classificationLebanonLesothoLibyaLithuaniaLow & middle incomeLower middle incomeLuxembourgMacedonia, FYRMalaysiaMaldivesMaltaMarshall IslandsMauritiusMexicoMiddle East & North AfricaMiddle East & North Africa (excluding high income)Middle East & North Africa (IDA & IBRD countries)Middle incomeMoldovaMongoliaMontenegroMoroccoMozambiqueMyanmarNamibiaNepalNetherlandsNew ZealandNicaraguaNigerNigeriaNorth AmericaNorwayOECD membersOmanOther small statesPacific island small statesPakistanPalauPanamaParaguayPeruPhilippinesPolandPortugalPost-demographic dividendPre-demographic dividendQatarRomaniaRussian FederationSamoaSao Tome and PrincipeSaudi ArabiaSenegalSerbiaSeychellesSingaporeSlovak RepublicSloveniaSmall statesSolomon IslandsSouth AfricaSouth AsiaSouth Asia (IDA & IBRD)South SudanSpainSri LankaSt. Kitts and NevisSt. LuciaSt. Vincent and the GrenadinesSub-Saharan Africa Sub-Saharan Africa (excluding high income)Sub-Saharan Africa (IDA & IBRD countries)SudanSurinameSwazilandSwedenSwitzerlandSyrian Arab RepublicTajikistanTanzaniaThailandTimor-LesteTogoTongaTrinidad and TobagoTunisiaTurkeyTurkmenistanUkraineUnited Arab EmiratesUnited KingdomUnited StatesUpper middle incomeUruguayUzbekistanVanuatuVenezuela, RBVietnamWorldYemen, Rep.ZambiaZimbabwe Timeline:
This timeline shows a graph from 1972 to 2014 of Late-demographic dividend. No data until 1971. Number of actual observations by date: 43.
Source name:
World Development Indicators
Source organization:
IEA Statistics © OECD/IEA 2014 (http://www.iea.org/stats/index.asp), subject to https://www.iea.org/t&c/termsandconditions/
Categories, topics:
Energy & Mining, Climate Change
Last updated:
apr 23, 2017
Indicators value changes by year
Minimum:
600.617
jan 1, 1972
Maximum:
2.248K
jan 1, 2014
At the date of observation
Value
Absolute change
Change from previous value
jan 1, 1972
600.617
+600.617
0.0%
jan 1, 1973
615.302
+14.686
2.45%
jan 1, 1974
630.224
+14.922
2.43%
jan 1, 1975
635.787
+5.563
0.88%
jan 1, 1976
673.26
+37.474
5.89%
jan 1, 1977
689.591
+16.33
2.43%
jan 1, 1978
727.137
+37.546
5.44%
jan 1, 1979
771.434
+44.297
6.09%
jan 1, 1980
783.227
+11.793
1.53%
jan 1, 1981
779.631
-3.597
-0.46%
jan 1, 1982
757.269
-22.361
-2.87%
jan 1, 1983
767.317
+10.047
1.33%
jan 1, 1984
776.396
+9.08
1.18%
jan 1, 1985
801.005
+24.608
3.17%
jan 1, 1986
815.848
+14.843
1.85%
jan 1, 1987
834.083
+18.235
2.24%
jan 1, 1988
856.908
+22.825
2.74%
jan 1, 1989
877.556
+20.648
2.41%
jan 1, 1990
879.225
+1.669
0.19%
jan 1, 1991
1.355K
+475.957
54.13%
jan 1, 1992
1.316K
-39.158
-2.89%
jan 1, 1993
1.268K
-47.852
-3.64%
jan 1, 1994
1.253K
-14.979
-1.18%
jan 1, 1995
1.21K
-42.869
-3.42%
jan 1, 1996
1.241K
+30.296
2.5%
jan 1, 1997
1.255K
+13.955
1.12%
jan 1, 1998
1.233K
-21.207
-1.69%
jan 1, 1999
1.216K
-17.079
-1.38%
jan 1, 2000
1.226K
+9.95
0.82%
jan 1, 2001
1.258K
+31.884
2.6%
jan 1, 2002
1.274K
+16.375
1.3%
jan 1, 2003
1.312K
+37.2
2.92%
jan 1, 2004
1.412K
+100.379
7.65%
jan 1, 2005
1.527K
+115.409
8.17%
jan 1, 2006
1.597K
+69.784
4.57%
jan 1, 2007
1.694K
+96.965
6.07%
jan 1, 2008
1.753K
+58.922
3.48%
jan 1, 2009
1.792K
+39.227
2.24%
jan 1, 2010
1.828K
+35.604
1.99%
jan 1, 2011
1.969K
+140.537
7.69%
jan 1, 2012
2.082K
+113.049
5.74%
jan 1, 2013
2.15K
+68.866
3.31%
jan 1, 2014
2.248K
+97.397
4.53%
Ranking of countries by current statistics by years


Comments: