29
/
en
AIzaSyAYiBZKx7MnpbEhh9jyipgxe19OcubqV5w
April 1, 2024
61545
Upper middle income
UMC
false
2
1
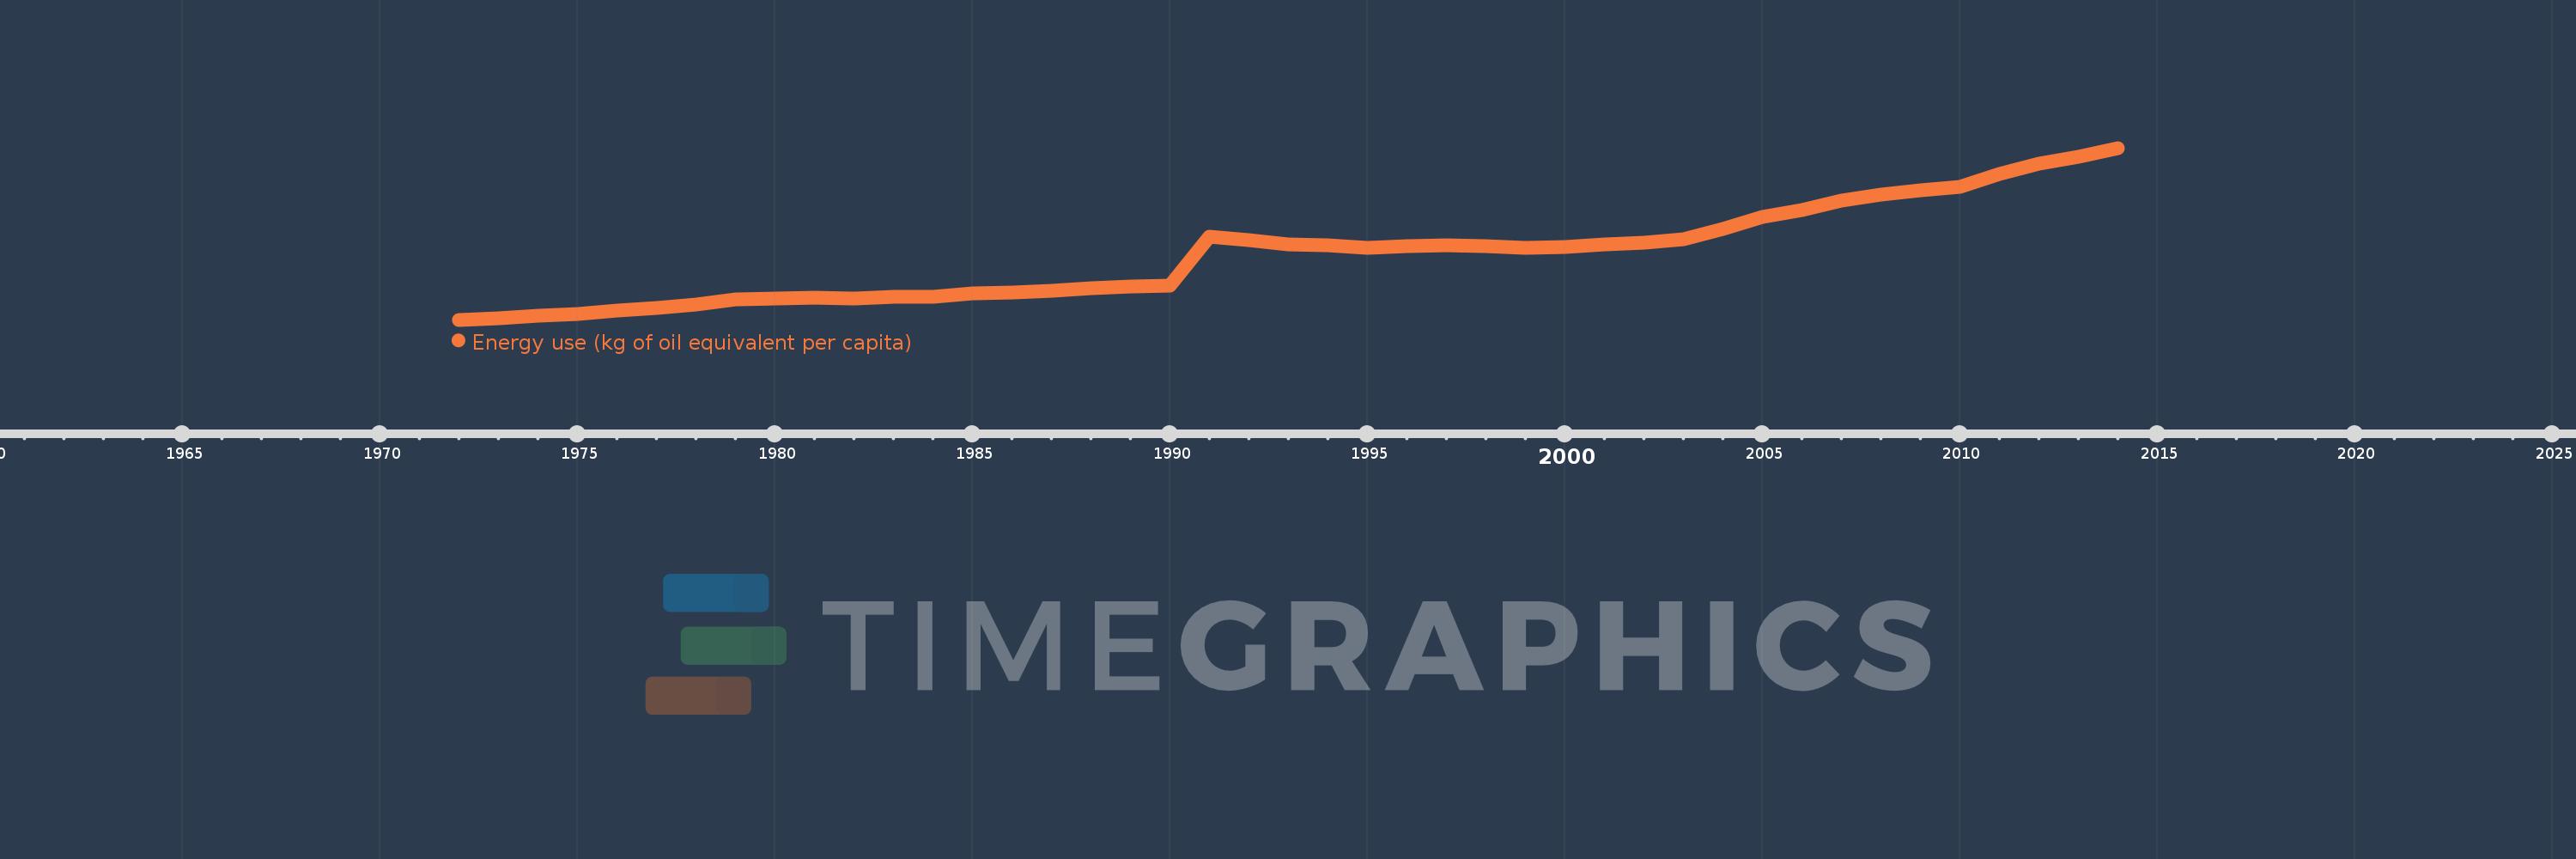
Energy use (kg of oil equivalent per capita)
2014,2013,2012,2011,2010,2009,2008,2007,2006,2005,2004,2003,2002,2001,2000,1999,1998,1997,1996,1995,1994,1993,1992,1991,1990,1989,1988,1987,1986,1985,1984,1983,1982,1981,1980,1979,1978,1977,1976,1975,1974,1973,1972
This statistics in other country:
AlbaniaAlgeriaAngolaAntigua and BarbudaArab WorldArgentinaArmeniaAustraliaAustriaAzerbaijanBahamas, TheBahrainBangladeshBarbadosBelarusBelgiumBelizeBeninBhutanBoliviaBosnia and HerzegovinaBotswanaBrazilBrunei DarussalamBulgariaCabo VerdeCambodiaCameroonCanadaCaribbean small statesCentral Europe and the BalticsChileChinaColombiaComorosCongo, Dem. Rep.Congo, Rep.Costa RicaCote d'IvoireCroatiaCubaCuracaoCyprusCzech RepublicDenmarkDjiboutiDominicaDominican RepublicEarly-demographic dividendEast Asia & PacificEast Asia & Pacific (excluding high income)East Asia & Pacific (IDA & IBRD countries)EcuadorEgypt, Arab Rep.El SalvadorEquatorial GuineaEritreaEstoniaEthiopiaEuro areaEurope & Central AsiaEurope & Central Asia (excluding high income)Europe & Central Asia (IDA & IBRD countries)European UnionFijiFinlandFragile and conflict affected situationsFranceGabonGambia, TheGeorgiaGermanyGhanaGibraltarGreeceGrenadaGuatemalaGuinea-BissauGuyanaHaitiHeavily indebted poor countries (HIPC)High incomeHondurasHong Kong SAR, ChinaHungaryIBRD onlyIcelandIDA & IBRD totalIDA blendIDA onlyIDA totalIndiaIndonesiaIran, Islamic Rep.IraqIrelandIsraelItalyJamaicaJapanJordanKazakhstanKenyaKiribatiKorea, Dem. People’s Rep.Korea, Rep.KosovoKuwaitKyrgyz RepublicLate-demographic dividendLatin America & Caribbean Latin America & Caribbean (excluding high income)Latin America & the Caribbean (IDA & IBRD countries)LatviaLeast developed countries: UN classificationLebanonLesothoLibyaLithuaniaLow & middle incomeLower middle incomeLuxembourgMacedonia, FYRMalaysiaMaldivesMaltaMarshall IslandsMauritiusMexicoMiddle East & North AfricaMiddle East & North Africa (excluding high income)Middle East & North Africa (IDA & IBRD countries)Middle incomeMoldovaMongoliaMontenegroMoroccoMozambiqueMyanmarNamibiaNepalNetherlandsNew ZealandNicaraguaNigerNigeriaNorth AmericaNorwayOECD membersOmanOther small statesPacific island small statesPakistanPalauPanamaParaguayPeruPhilippinesPolandPortugalPost-demographic dividendPre-demographic dividendQatarRomaniaRussian FederationSamoaSao Tome and PrincipeSaudi ArabiaSenegalSerbiaSeychellesSingaporeSlovak RepublicSloveniaSmall statesSolomon IslandsSouth AfricaSouth AsiaSouth Asia (IDA & IBRD)South SudanSpainSri LankaSt. Kitts and NevisSt. LuciaSt. Vincent and the GrenadinesSub-Saharan Africa Sub-Saharan Africa (excluding high income)Sub-Saharan Africa (IDA & IBRD countries)SudanSurinameSwazilandSwedenSwitzerlandSyrian Arab RepublicTajikistanTanzaniaThailandTimor-LesteTogoTongaTrinidad and TobagoTunisiaTurkeyTurkmenistanUkraineUnited Arab EmiratesUnited KingdomUnited StatesUpper middle incomeUruguayUzbekistanVanuatuVenezuela, RBVietnamWorldYemen, Rep.ZambiaZimbabwe Timeline:
This timeline shows a graph from 1972 to 2014 of Upper middle income. No data until 1971. Number of actual observations by date: 43.
Source name:
World Development Indicators
Source organization:
IEA Statistics © OECD/IEA 2014 (http://www.iea.org/stats/index.asp), subject to https://www.iea.org/t&c/termsandconditions/
Categories, topics:
Energy & Mining, Climate Change
Last updated:
apr 23, 2017
Indicators value changes by year
Minimum:
599.959
jan 1, 1972
At the date of observation
Value
Absolute change
Change from previous value
jan 1, 1972
599.959
+599.959
0.0%
jan 1, 1973
614.521
+14.562
2.43%
jan 1, 1974
637.459
+22.938
3.73%
jan 1, 1975
649.891
+12.432
1.95%
jan 1, 1976
686.158
+36.267
5.58%
jan 1, 1977
705.753
+19.595
2.86%
jan 1, 1978
744.134
+38.381
5.44%
jan 1, 1979
784.527
+40.393
5.43%
jan 1, 1980
797.795
+13.268
1.69%
jan 1, 1981
802.71
+4.915
0.62%
jan 1, 1982
797.667
-5.043
-0.63%
jan 1, 1983
813.674
+16.007
2.01%
jan 1, 1984
815.552
+1.878
0.23%
jan 1, 1985
844.59
+29.038
3.56%
jan 1, 1986
852.738
+8.148
0.96%
jan 1, 1987
867.792
+15.054
1.77%
jan 1, 1988
891.108
+23.316
2.69%
jan 1, 1989
909.579
+18.471
2.07%
jan 1, 1990
916.043
+6.464
0.71%
jan 1, 1991
1.37K
+453.623
49.52%
jan 1, 1992
1.337K
-32.727
-2.39%
jan 1, 1993
1.298K
-38.498
-2.88%
jan 1, 1994
1.289K
-9.394
-0.72%
jan 1, 1995
1.263K
-25.735
-2.0%
jan 1, 1996
1.283K
+20.116
1.59%
jan 1, 1997
1.293K
+9.294
0.72%
jan 1, 1998
1.282K
-10.333
-0.8%
jan 1, 1999
1.265K
-17.883
-1.39%
jan 1, 2000
1.273K
+8.805
0.7%
jan 1, 2001
1.301K
+27.947
2.19%
jan 1, 2002
1.314K
+12.439
0.96%
jan 1, 2003
1.345K
+31.217
2.38%
jan 1, 2004
1.438K
+92.689
6.89%
jan 1, 2005
1.549K
+111.115
7.73%
jan 1, 2006
1.615K
+65.8
4.25%
jan 1, 2007
1.701K
+86.746
5.37%
jan 1, 2008
1.758K
+56.292
3.31%
jan 1, 2009
1.8K
+42.296
2.41%
jan 1, 2010
1.827K
+27.065
1.5%
jan 1, 2011
1.947K
+119.583
6.55%
jan 1, 2012
2.045K
+98.795
5.08%
jan 1, 2013
2.109K
+63.553
3.11%
jan 1, 2014
2.19K
+81.449
3.86%
Ranking of countries by current statistics by years


Comments: