29
/
en
AIzaSyAYiBZKx7MnpbEhh9jyipgxe19OcubqV5w
April 1, 2024
182012
Luxembourg
LUX
true
2
1
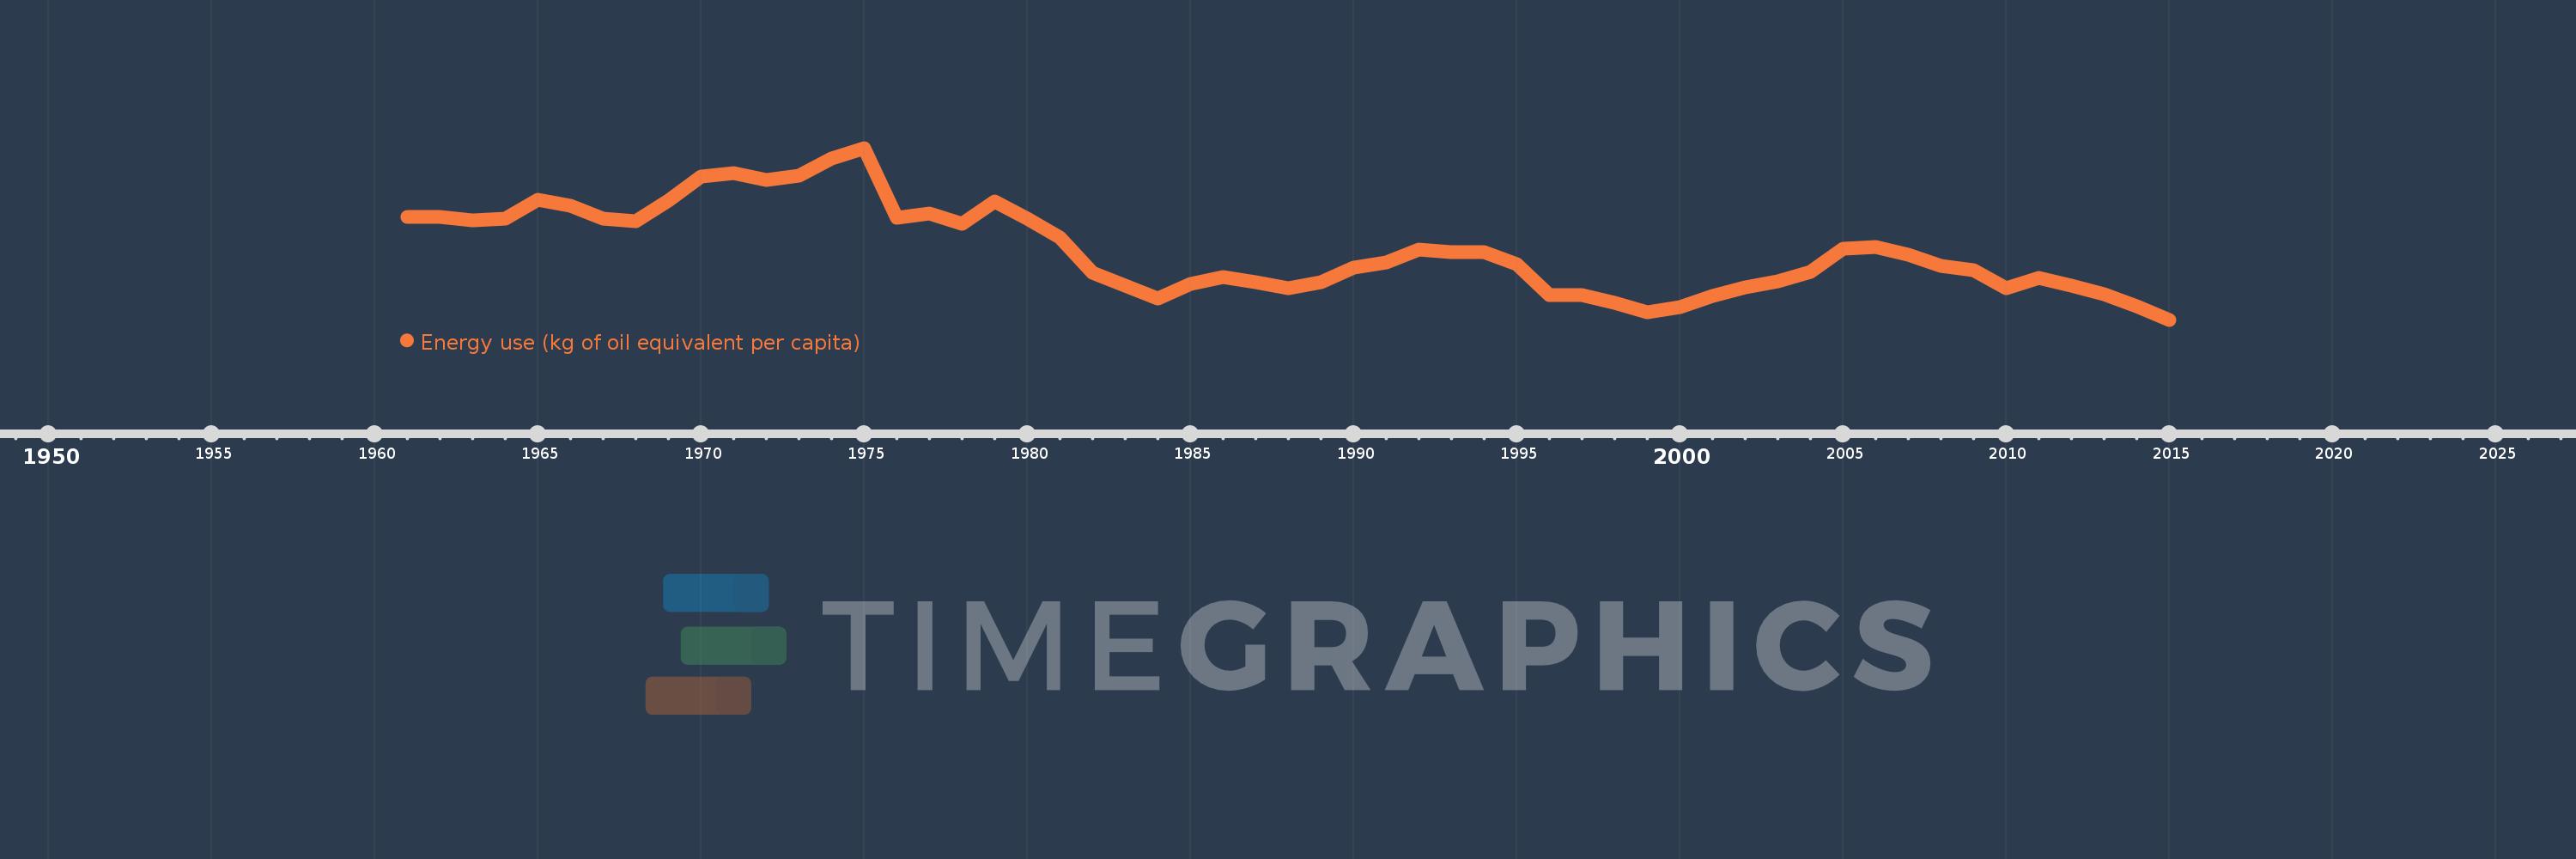
Energy use (kg of oil equivalent per capita)
2015,2014,2013,2012,2011,2010,2009,2008,2007,2006,2005,2004,2003,2002,2001,2000,1999,1998,1997,1996,1995,1994,1993,1992,1991,1990,1989,1988,1987,1986,1985,1984,1983,1982,1981,1980,1979,1978,1977,1976,1975,1974,1973,1972,1971,1970,1969,1968,1967,1966,1965,1964,1963,1962,1961
This statistics in other country:
AlbaniaAlgeriaAngolaAntigua and BarbudaArab WorldArgentinaArmeniaAustraliaAustriaAzerbaijanBahamas, TheBahrainBangladeshBarbadosBelarusBelgiumBelizeBeninBhutanBoliviaBosnia and HerzegovinaBotswanaBrazilBrunei DarussalamBulgariaCabo VerdeCambodiaCameroonCanadaCaribbean small statesCentral Europe and the BalticsChileChinaColombiaComorosCongo, Dem. Rep.Congo, Rep.Costa RicaCote d'IvoireCroatiaCubaCuracaoCyprusCzech RepublicDenmarkDjiboutiDominicaDominican RepublicEarly-demographic dividendEast Asia & PacificEast Asia & Pacific (excluding high income)East Asia & Pacific (IDA & IBRD countries)EcuadorEgypt, Arab Rep.El SalvadorEquatorial GuineaEritreaEstoniaEthiopiaEuro areaEurope & Central AsiaEurope & Central Asia (excluding high income)Europe & Central Asia (IDA & IBRD countries)European UnionFijiFinlandFragile and conflict affected situationsFranceGabonGambia, TheGeorgiaGermanyGhanaGibraltarGreeceGrenadaGuatemalaGuinea-BissauGuyanaHaitiHeavily indebted poor countries (HIPC)High incomeHondurasHong Kong SAR, ChinaHungaryIBRD onlyIcelandIDA & IBRD totalIDA blendIDA onlyIDA totalIndiaIndonesiaIran, Islamic Rep.IraqIrelandIsraelItalyJamaicaJapanJordanKazakhstanKenyaKiribatiKorea, Dem. People’s Rep.Korea, Rep.KosovoKuwaitKyrgyz RepublicLate-demographic dividendLatin America & Caribbean Latin America & Caribbean (excluding high income)Latin America & the Caribbean (IDA & IBRD countries)LatviaLeast developed countries: UN classificationLebanonLesothoLibyaLithuaniaLow & middle incomeLower middle incomeLuxembourgMacedonia, FYRMalaysiaMaldivesMaltaMarshall IslandsMauritiusMexicoMiddle East & North AfricaMiddle East & North Africa (excluding high income)Middle East & North Africa (IDA & IBRD countries)Middle incomeMoldovaMongoliaMontenegroMoroccoMozambiqueMyanmarNamibiaNepalNetherlandsNew ZealandNicaraguaNigerNigeriaNorth AmericaNorwayOECD membersOmanOther small statesPacific island small statesPakistanPalauPanamaParaguayPeruPhilippinesPolandPortugalPost-demographic dividendPre-demographic dividendQatarRomaniaRussian FederationSamoaSao Tome and PrincipeSaudi ArabiaSenegalSerbiaSeychellesSingaporeSlovak RepublicSloveniaSmall statesSolomon IslandsSouth AfricaSouth AsiaSouth Asia (IDA & IBRD)South SudanSpainSri LankaSt. Kitts and NevisSt. LuciaSt. Vincent and the GrenadinesSub-Saharan Africa Sub-Saharan Africa (excluding high income)Sub-Saharan Africa (IDA & IBRD countries)SudanSurinameSwazilandSwedenSwitzerlandSyrian Arab RepublicTajikistanTanzaniaThailandTimor-LesteTogoTongaTrinidad and TobagoTunisiaTurkeyTurkmenistanUkraineUnited Arab EmiratesUnited KingdomUnited StatesUpper middle incomeUruguayUzbekistanVanuatuVenezuela, RBVietnamWorldYemen, Rep.ZambiaZimbabwe Timeline:
This timeline shows a graph from 1961 to 2015 of Luxembourg. No data until 1960. Number of actual observations by date: 55.
Source name:
World Development Indicators
Source organization:
IEA Statistics © OECD/IEA 2014 (http://www.iea.org/stats/index.asp), subject to https://www.iea.org/t&c/termsandconditions/
Categories, topics:
Energy & Mining, Climate Change
Last updated:
apr 23, 2017
Indicators value changes by year
Minimum:
6.812K
jan 1, 2015
Maximum:
13.024K
jan 1, 1975
At the date of observation
Value
Absolute change
Change from previous value
jan 1, 1961
10.523K
+10.523K
0.0%
jan 1, 1962
10.534K
+10.612
0.1%
jan 1, 1963
10.415K
-119.477
-1.13%
jan 1, 1964
10.466K
+51.272
0.49%
jan 1, 1965
11.15K
+684.237
6.54%
jan 1, 1966
10.926K
-223.655
-2.01%
jan 1, 1967
10.481K
-445.789
-4.08%
jan 1, 1968
10.362K
-118.634
-1.13%
jan 1, 1969
11.115K
+752.695
7.26%
jan 1, 1970
11.974K
+859.525
7.73%
jan 1, 1971
12.106K
+131.96
1.1%
jan 1, 1972
11.863K
-243.063
-2.01%
jan 1, 1973
12.01K
+146.481
1.23%
jan 1, 1974
12.649K
+638.99
5.32%
jan 1, 1975
13.024K
+375.329
2.97%
jan 1, 1976
10.505K
-2.519K
-19.34%
jan 1, 1977
10.669K
+163.586
1.56%
jan 1, 1978
10.279K
-390.01
-3.66%
jan 1, 1979
11.096K
+817.446
7.95%
jan 1, 1980
10.458K
-637.891
-5.75%
jan 1, 1981
9.775K
-683.462
-6.54%
jan 1, 1982
8.526K
-1.249K
-12.77%
jan 1, 1983
8.058K
-468.227
-5.49%
jan 1, 1984
7.576K
-481.603
-5.98%
jan 1, 1985
8.113K
+536.468
7.08%
jan 1, 1986
8.347K
+234.251
2.89%
jan 1, 1987
8.164K
-183.378
-2.2%
jan 1, 1988
7.943K
-220.601
-2.7%
jan 1, 1989
8.158K
+215.485
2.71%
jan 1, 1990
8.7K
+541.503
6.64%
jan 1, 1991
8.874K
+174.169
2.0%
jan 1, 1992
9.353K
+479.316
5.4%
jan 1, 1993
9.262K
-91.339
-0.98%
jan 1, 1994
9.267K
+4.861
0.05%
jan 1, 1995
8.823K
-443.69
-4.79%
jan 1, 1996
7.705K
-1.118K
-12.67%
jan 1, 1997
7.711K
+5.772
0.07%
jan 1, 1998
7.41K
-301.328
-3.91%
jan 1, 1999
7.067K
-342.966
-4.63%
jan 1, 2000
7.267K
+200.088
2.83%
jan 1, 2001
7.677K
+409.865
5.64%
jan 1, 2002
7.983K
+306.013
3.99%
jan 1, 2003
8.205K
+221.876
2.78%
jan 1, 2004
8.55K
+344.776
4.2%
jan 1, 2005
9.387K
+837.934
9.8%
jan 1, 2006
9.429K
+41.374
0.44%
jan 1, 2007
9.171K
-258.279
-2.74%
jan 1, 2008
8.774K
-396.636
-4.33%
jan 1, 2009
8.612K
-161.663
-1.84%
jan 1, 2010
7.952K
-660.51
-7.67%
jan 1, 2011
8.329K
+377.707
4.75%
jan 1, 2012
8.056K
-273.073
-3.28%
jan 1, 2013
7.722K
-334.394
-4.15%
jan 1, 2014
7.31K
-411.654
-5.33%
jan 1, 2015
6.812K
-498.114
-6.81%
Ranking of countries by current statistics by years


Comments: