29
/
en
AIzaSyAYiBZKx7MnpbEhh9jyipgxe19OcubqV5w
April 1, 2024
83999
Benin
BEN
true
2
1
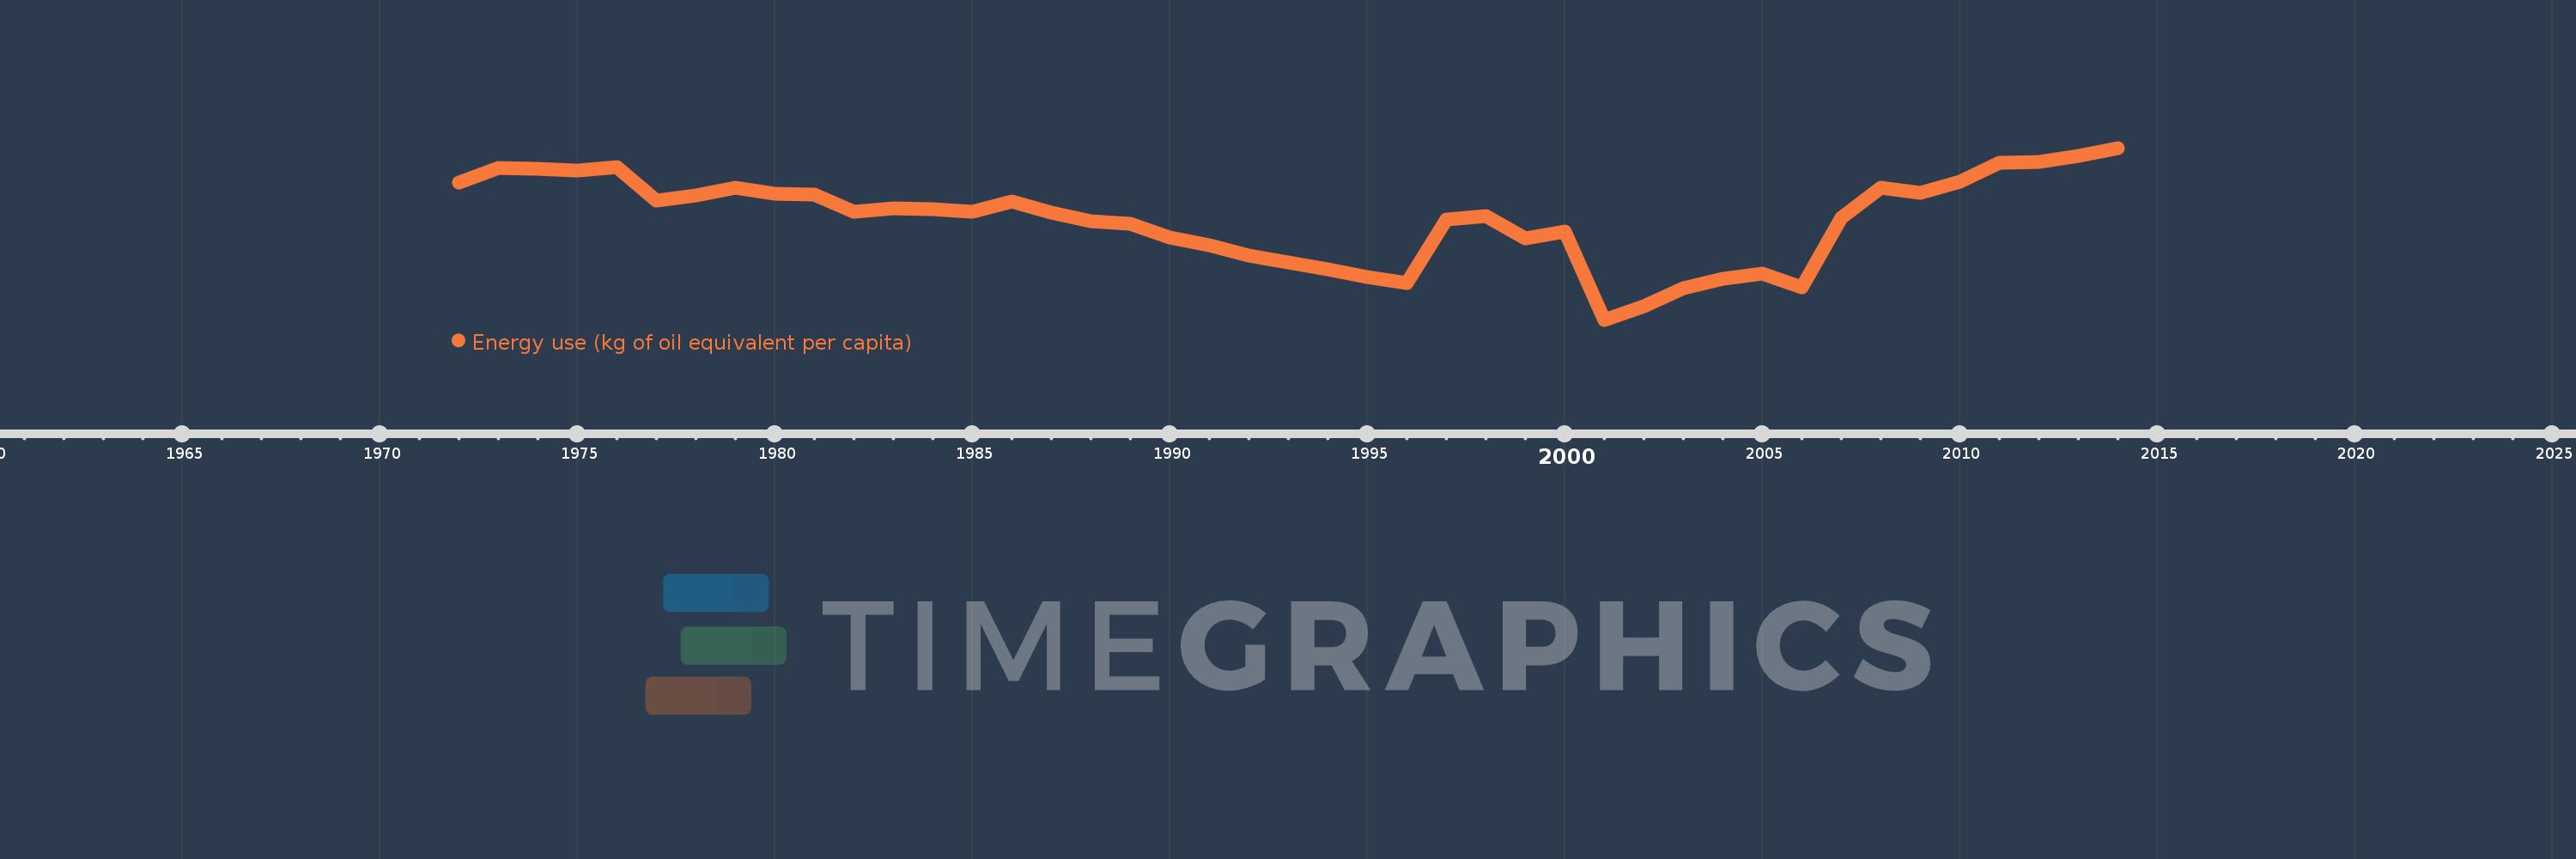
Energy use (kg of oil equivalent per capita)
2014,2013,2012,2011,2010,2009,2008,2007,2006,2005,2004,2003,2002,2001,2000,1999,1998,1997,1996,1995,1994,1993,1992,1991,1990,1989,1988,1987,1986,1985,1984,1983,1982,1981,1980,1979,1978,1977,1976,1975,1974,1973,1972
This statistics in other country:
AlbaniaAlgeriaAngolaAntigua and BarbudaArab WorldArgentinaArmeniaAustraliaAustriaAzerbaijanBahamas, TheBahrainBangladeshBarbadosBelarusBelgiumBelizeBeninBhutanBoliviaBosnia and HerzegovinaBotswanaBrazilBrunei DarussalamBulgariaCabo VerdeCambodiaCameroonCanadaCaribbean small statesCentral Europe and the BalticsChileChinaColombiaComorosCongo, Dem. Rep.Congo, Rep.Costa RicaCote d'IvoireCroatiaCubaCuracaoCyprusCzech RepublicDenmarkDjiboutiDominicaDominican RepublicEarly-demographic dividendEast Asia & PacificEast Asia & Pacific (excluding high income)East Asia & Pacific (IDA & IBRD countries)EcuadorEgypt, Arab Rep.El SalvadorEquatorial GuineaEritreaEstoniaEthiopiaEuro areaEurope & Central AsiaEurope & Central Asia (excluding high income)Europe & Central Asia (IDA & IBRD countries)European UnionFijiFinlandFragile and conflict affected situationsFranceGabonGambia, TheGeorgiaGermanyGhanaGibraltarGreeceGrenadaGuatemalaGuinea-BissauGuyanaHaitiHeavily indebted poor countries (HIPC)High incomeHondurasHong Kong SAR, ChinaHungaryIBRD onlyIcelandIDA & IBRD totalIDA blendIDA onlyIDA totalIndiaIndonesiaIran, Islamic Rep.IraqIrelandIsraelItalyJamaicaJapanJordanKazakhstanKenyaKiribatiKorea, Dem. People’s Rep.Korea, Rep.KosovoKuwaitKyrgyz RepublicLate-demographic dividendLatin America & Caribbean Latin America & Caribbean (excluding high income)Latin America & the Caribbean (IDA & IBRD countries)LatviaLeast developed countries: UN classificationLebanonLesothoLibyaLithuaniaLow & middle incomeLower middle incomeLuxembourgMacedonia, FYRMalaysiaMaldivesMaltaMarshall IslandsMauritiusMexicoMiddle East & North AfricaMiddle East & North Africa (excluding high income)Middle East & North Africa (IDA & IBRD countries)Middle incomeMoldovaMongoliaMontenegroMoroccoMozambiqueMyanmarNamibiaNepalNetherlandsNew ZealandNicaraguaNigerNigeriaNorth AmericaNorwayOECD membersOmanOther small statesPacific island small statesPakistanPalauPanamaParaguayPeruPhilippinesPolandPortugalPost-demographic dividendPre-demographic dividendQatarRomaniaRussian FederationSamoaSao Tome and PrincipeSaudi ArabiaSenegalSerbiaSeychellesSingaporeSlovak RepublicSloveniaSmall statesSolomon IslandsSouth AfricaSouth AsiaSouth Asia (IDA & IBRD)South SudanSpainSri LankaSt. Kitts and NevisSt. LuciaSt. Vincent and the GrenadinesSub-Saharan Africa Sub-Saharan Africa (excluding high income)Sub-Saharan Africa (IDA & IBRD countries)SudanSurinameSwazilandSwedenSwitzerlandSyrian Arab RepublicTajikistanTanzaniaThailandTimor-LesteTogoTongaTrinidad and TobagoTunisiaTurkeyTurkmenistanUkraineUnited Arab EmiratesUnited KingdomUnited StatesUpper middle incomeUruguayUzbekistanVanuatuVenezuela, RBVietnamWorldYemen, Rep.ZambiaZimbabwe Timeline:
This timeline shows a graph from 1972 to 2014 of Benin. No data until 1971. Number of actual observations by date: 43.
Source name:
World Development Indicators
Source organization:
IEA Statistics © OECD/IEA 2014 (http://www.iea.org/stats/index.asp), subject to https://www.iea.org/t&c/termsandconditions/
Categories, topics:
Energy & Mining, Climate Change
Last updated:
apr 23, 2017
Indicators value changes by year
Minimum:
285.302
jan 1, 2001
Maximum:
393.384
jan 1, 2014
At the date of observation
Value
Absolute change
Change from previous value
jan 1, 1972
371.803
+371.803
0.0%
jan 1, 1973
380.812
+9.009
2.42%
jan 1, 1974
380.161
-0.651
-0.17%
jan 1, 1975
379.377
-0.785
-0.21%
jan 1, 1976
381.114
+1.737
0.46%
jan 1, 1977
360.416
-20.698
-5.43%
jan 1, 1978
363.746
+3.33
0.92%
jan 1, 1979
368.252
+4.506
1.24%
jan 1, 1980
364.67
-3.582
-0.97%
jan 1, 1981
363.782
-0.888
-0.24%
jan 1, 1982
353.271
-10.511
-2.89%
jan 1, 1983
355.338
+2.067
0.59%
jan 1, 1984
354.986
-0.352
-0.1%
jan 1, 1985
353.329
-1.657
-0.47%
jan 1, 1986
359.825
+6.496
1.84%
jan 1, 1987
352.776
-7.048
-1.96%
jan 1, 1988
347.307
-5.47
-1.55%
jan 1, 1989
345.697
-1.61
-0.46%
jan 1, 1990
336.859
-8.838
-2.56%
jan 1, 1991
332.179
-4.68
-1.39%
jan 1, 1992
325.453
-6.726
-2.02%
jan 1, 1993
321.349
-4.103
-1.26%
jan 1, 1994
316.873
-4.477
-1.39%
jan 1, 1995
312.327
-4.546
-1.43%
jan 1, 1996
308.576
-3.751
-1.2%
jan 1, 1997
348.231
+39.655
12.85%
jan 1, 1998
350.79
+2.558
0.73%
jan 1, 1999
336.24
-14.549
-4.15%
jan 1, 2000
340.657
+4.416
1.31%
jan 1, 2001
285.302
-55.355
-16.25%
jan 1, 2002
293.878
+8.575
3.01%
jan 1, 2003
305.049
+11.172
3.8%
jan 1, 2004
311.193
+6.144
2.01%
jan 1, 2005
314.347
+3.154
1.01%
jan 1, 2006
305.448
-8.899
-2.83%
jan 1, 2007
349.258
+43.81
14.34%
jan 1, 2008
368.216
+18.959
5.43%
jan 1, 2009
365.243
-2.973
-0.81%
jan 1, 2010
372.121
+6.878
1.88%
jan 1, 2011
384.168
+12.047
3.24%
jan 1, 2012
384.334
+0.166
0.04%
jan 1, 2013
388.517
+4.183
1.09%
jan 1, 2014
393.384
+4.867
1.25%
Ranking of countries by current statistics by years


Comments: