29
/
en
AIzaSyAYiBZKx7MnpbEhh9jyipgxe19OcubqV5w
April 1, 2024
34179
Fragile and conflict affected situations
FCS
false
2
1
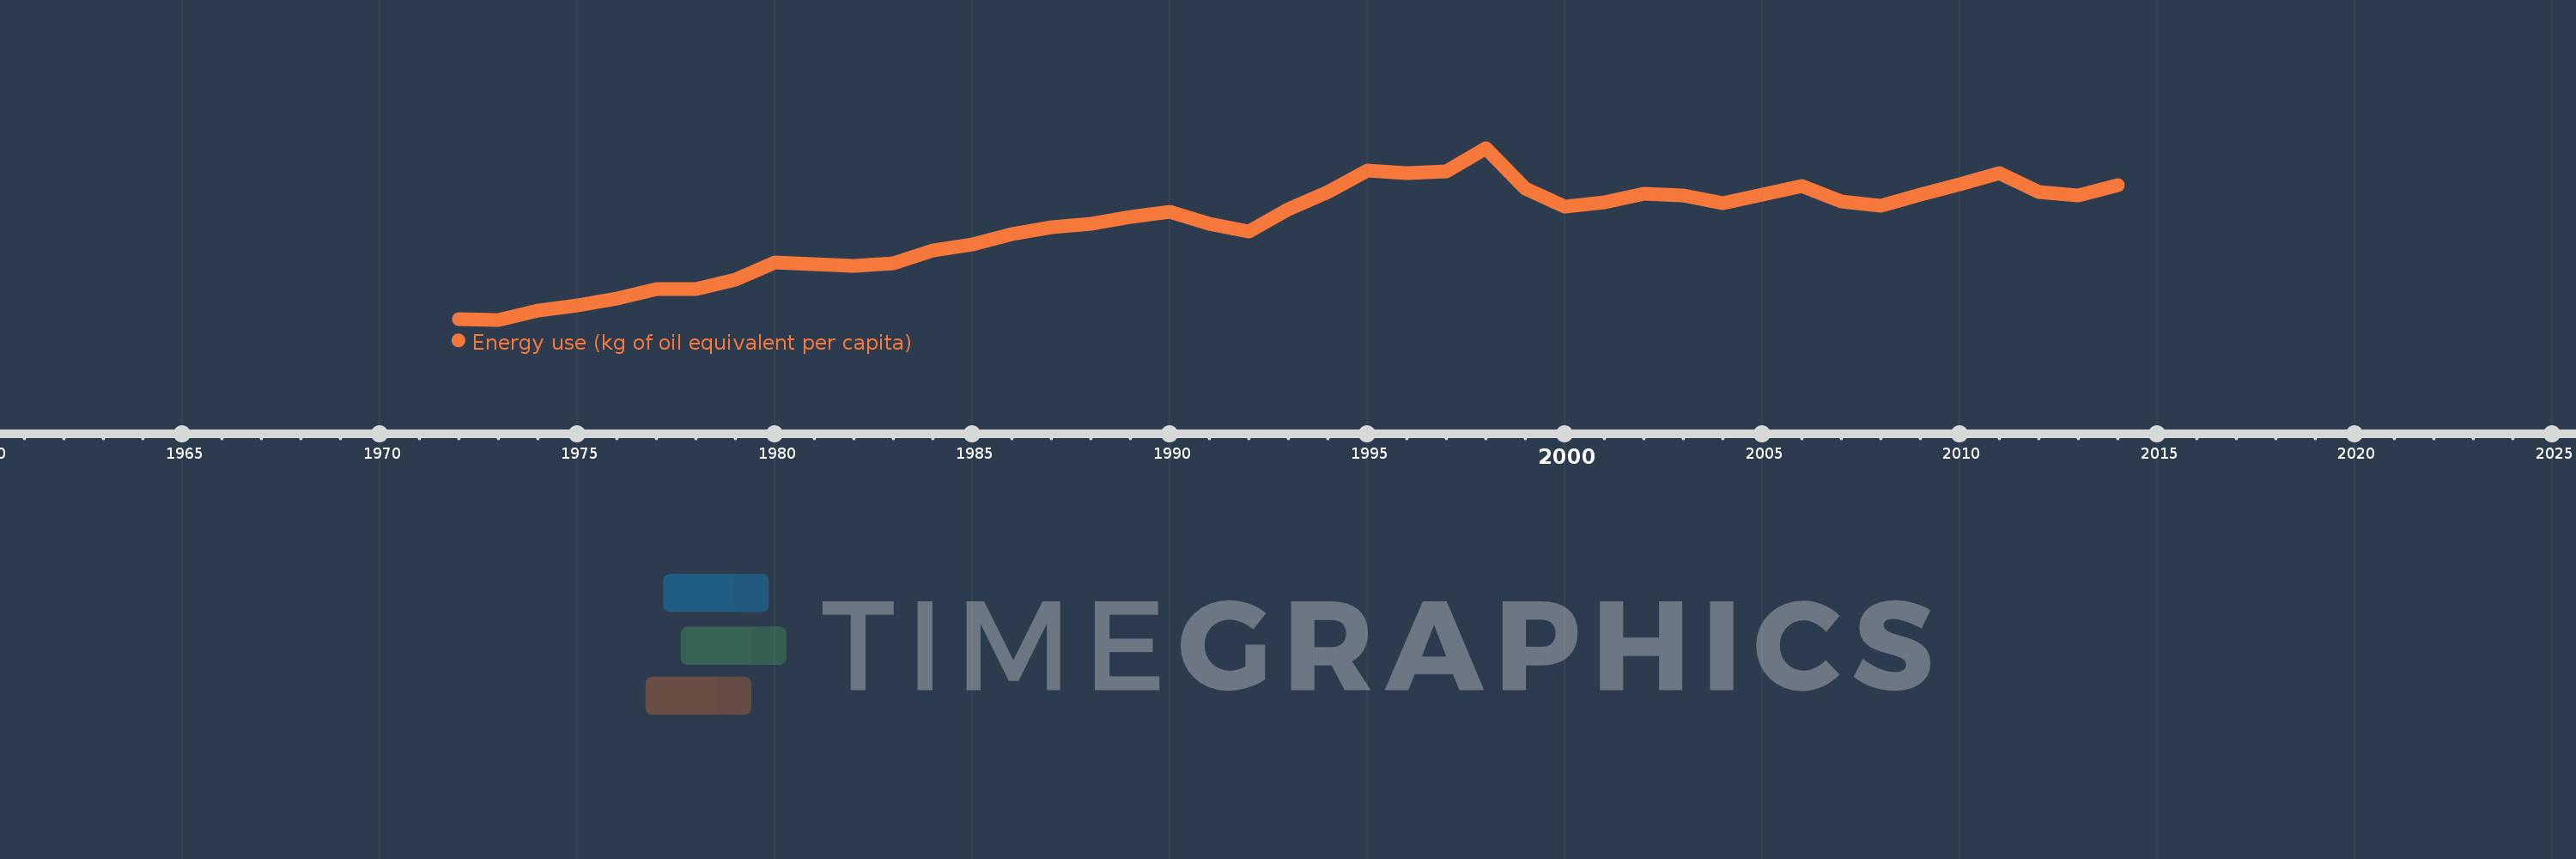
Energy use (kg of oil equivalent per capita)
2014,2013,2012,2011,2010,2009,2008,2007,2006,2005,2004,2003,2002,2001,2000,1999,1998,1997,1996,1995,1994,1993,1992,1991,1990,1989,1988,1987,1986,1985,1984,1983,1982,1981,1980,1979,1978,1977,1976,1975,1974,1973,1972
This statistics in other country:
AlbaniaAlgeriaAngolaAntigua and BarbudaArab WorldArgentinaArmeniaAustraliaAustriaAzerbaijanBahamas, TheBahrainBangladeshBarbadosBelarusBelgiumBelizeBeninBhutanBoliviaBosnia and HerzegovinaBotswanaBrazilBrunei DarussalamBulgariaCabo VerdeCambodiaCameroonCanadaCaribbean small statesCentral Europe and the BalticsChileChinaColombiaComorosCongo, Dem. Rep.Congo, Rep.Costa RicaCote d'IvoireCroatiaCubaCuracaoCyprusCzech RepublicDenmarkDjiboutiDominicaDominican RepublicEarly-demographic dividendEast Asia & PacificEast Asia & Pacific (excluding high income)East Asia & Pacific (IDA & IBRD countries)EcuadorEgypt, Arab Rep.El SalvadorEquatorial GuineaEritreaEstoniaEthiopiaEuro areaEurope & Central AsiaEurope & Central Asia (excluding high income)Europe & Central Asia (IDA & IBRD countries)European UnionFijiFinlandFragile and conflict affected situationsFranceGabonGambia, TheGeorgiaGermanyGhanaGibraltarGreeceGrenadaGuatemalaGuinea-BissauGuyanaHaitiHeavily indebted poor countries (HIPC)High incomeHondurasHong Kong SAR, ChinaHungaryIBRD onlyIcelandIDA & IBRD totalIDA blendIDA onlyIDA totalIndiaIndonesiaIran, Islamic Rep.IraqIrelandIsraelItalyJamaicaJapanJordanKazakhstanKenyaKiribatiKorea, Dem. People’s Rep.Korea, Rep.KosovoKuwaitKyrgyz RepublicLate-demographic dividendLatin America & Caribbean Latin America & Caribbean (excluding high income)Latin America & the Caribbean (IDA & IBRD countries)LatviaLeast developed countries: UN classificationLebanonLesothoLibyaLithuaniaLow & middle incomeLower middle incomeLuxembourgMacedonia, FYRMalaysiaMaldivesMaltaMarshall IslandsMauritiusMexicoMiddle East & North AfricaMiddle East & North Africa (excluding high income)Middle East & North Africa (IDA & IBRD countries)Middle incomeMoldovaMongoliaMontenegroMoroccoMozambiqueMyanmarNamibiaNepalNetherlandsNew ZealandNicaraguaNigerNigeriaNorth AmericaNorwayOECD membersOmanOther small statesPacific island small statesPakistanPalauPanamaParaguayPeruPhilippinesPolandPortugalPost-demographic dividendPre-demographic dividendQatarRomaniaRussian FederationSamoaSao Tome and PrincipeSaudi ArabiaSenegalSerbiaSeychellesSingaporeSlovak RepublicSloveniaSmall statesSolomon IslandsSouth AfricaSouth AsiaSouth Asia (IDA & IBRD)South SudanSpainSri LankaSt. Kitts and NevisSt. LuciaSt. Vincent and the GrenadinesSub-Saharan Africa Sub-Saharan Africa (excluding high income)Sub-Saharan Africa (IDA & IBRD countries)SudanSurinameSwazilandSwedenSwitzerlandSyrian Arab RepublicTajikistanTanzaniaThailandTimor-LesteTogoTongaTrinidad and TobagoTunisiaTurkeyTurkmenistanUkraineUnited Arab EmiratesUnited KingdomUnited StatesUpper middle incomeUruguayUzbekistanVanuatuVenezuela, RBVietnamWorldYemen, Rep.ZambiaZimbabwe Timeline:
This timeline shows a graph from 1972 to 2014 of Fragile and conflict affected situations. No data until 1971. Number of actual observations by date: 43.
Source name:
World Development Indicators
Source organization:
IEA Statistics © OECD/IEA 2014 (http://www.iea.org/stats/index.asp), subject to https://www.iea.org/t&c/termsandconditions/
Categories, topics:
Energy & Mining, Climate Change
Last updated:
apr 23, 2017
Indicators value changes by year
Minimum:
386.755
jan 1, 1973
Maximum:
607.704
jan 1, 1998
At the date of observation
Value
Absolute change
Change from previous value
jan 1, 1972
387.144
+387.144
0.0%
jan 1, 1973
386.755
-0.39
-0.1%
jan 1, 1974
398.033
+11.279
2.92%
jan 1, 1975
404.681
+6.648
1.67%
jan 1, 1976
413.52
+8.839
2.18%
jan 1, 1977
425.901
+12.38
2.99%
jan 1, 1978
426.594
+0.693
0.16%
jan 1, 1979
438.657
+12.063
2.83%
jan 1, 1980
460.612
+21.955
5.01%
jan 1, 1981
457.954
-2.658
-0.58%
jan 1, 1982
456.144
-1.81
-0.4%
jan 1, 1983
459.67
+3.526
0.77%
jan 1, 1984
476.394
+16.723
3.64%
jan 1, 1985
483.512
+7.118
1.49%
jan 1, 1986
497.149
+13.637
2.82%
jan 1, 1987
505.269
+8.12
1.63%
jan 1, 1988
510.157
+4.888
0.97%
jan 1, 1989
518.501
+8.344
1.64%
jan 1, 1990
526.057
+7.556
1.46%
jan 1, 1991
510.511
-15.546
-2.96%
jan 1, 1992
500.132
-10.379
-2.03%
jan 1, 1993
528.486
+28.354
5.67%
jan 1, 1994
550.68
+22.194
4.2%
jan 1, 1995
578.328
+27.647
5.02%
jan 1, 1996
574.901
-3.427
-0.59%
jan 1, 1997
577.585
+2.684
0.47%
jan 1, 1998
607.704
+30.12
5.21%
jan 1, 1999
555.735
-51.97
-8.55%
jan 1, 2000
532.102
-23.633
-4.25%
jan 1, 2001
537.324
+5.222
0.98%
jan 1, 2002
548.654
+11.331
2.11%
jan 1, 2003
547.092
-1.563
-0.28%
jan 1, 2004
536.936
-10.156
-1.86%
jan 1, 2005
547.229
+10.293
1.92%
jan 1, 2006
558.972
+11.743
2.15%
jan 1, 2007
538.452
-20.52
-3.67%
jan 1, 2008
532.884
-5.569
-1.03%
jan 1, 2009
547.255
+14.371
2.7%
jan 1, 2010
561.501
+14.246
2.6%
jan 1, 2011
575.493
+13.992
2.49%
jan 1, 2012
551.485
-24.008
-4.17%
jan 1, 2013
547.128
-4.358
-0.79%
jan 1, 2014
560.115
+12.987
2.37%
Ranking of countries by current statistics by years


Comments: