29
/
en
AIzaSyAYiBZKx7MnpbEhh9jyipgxe19OcubqV5w
April 1, 2024
56412
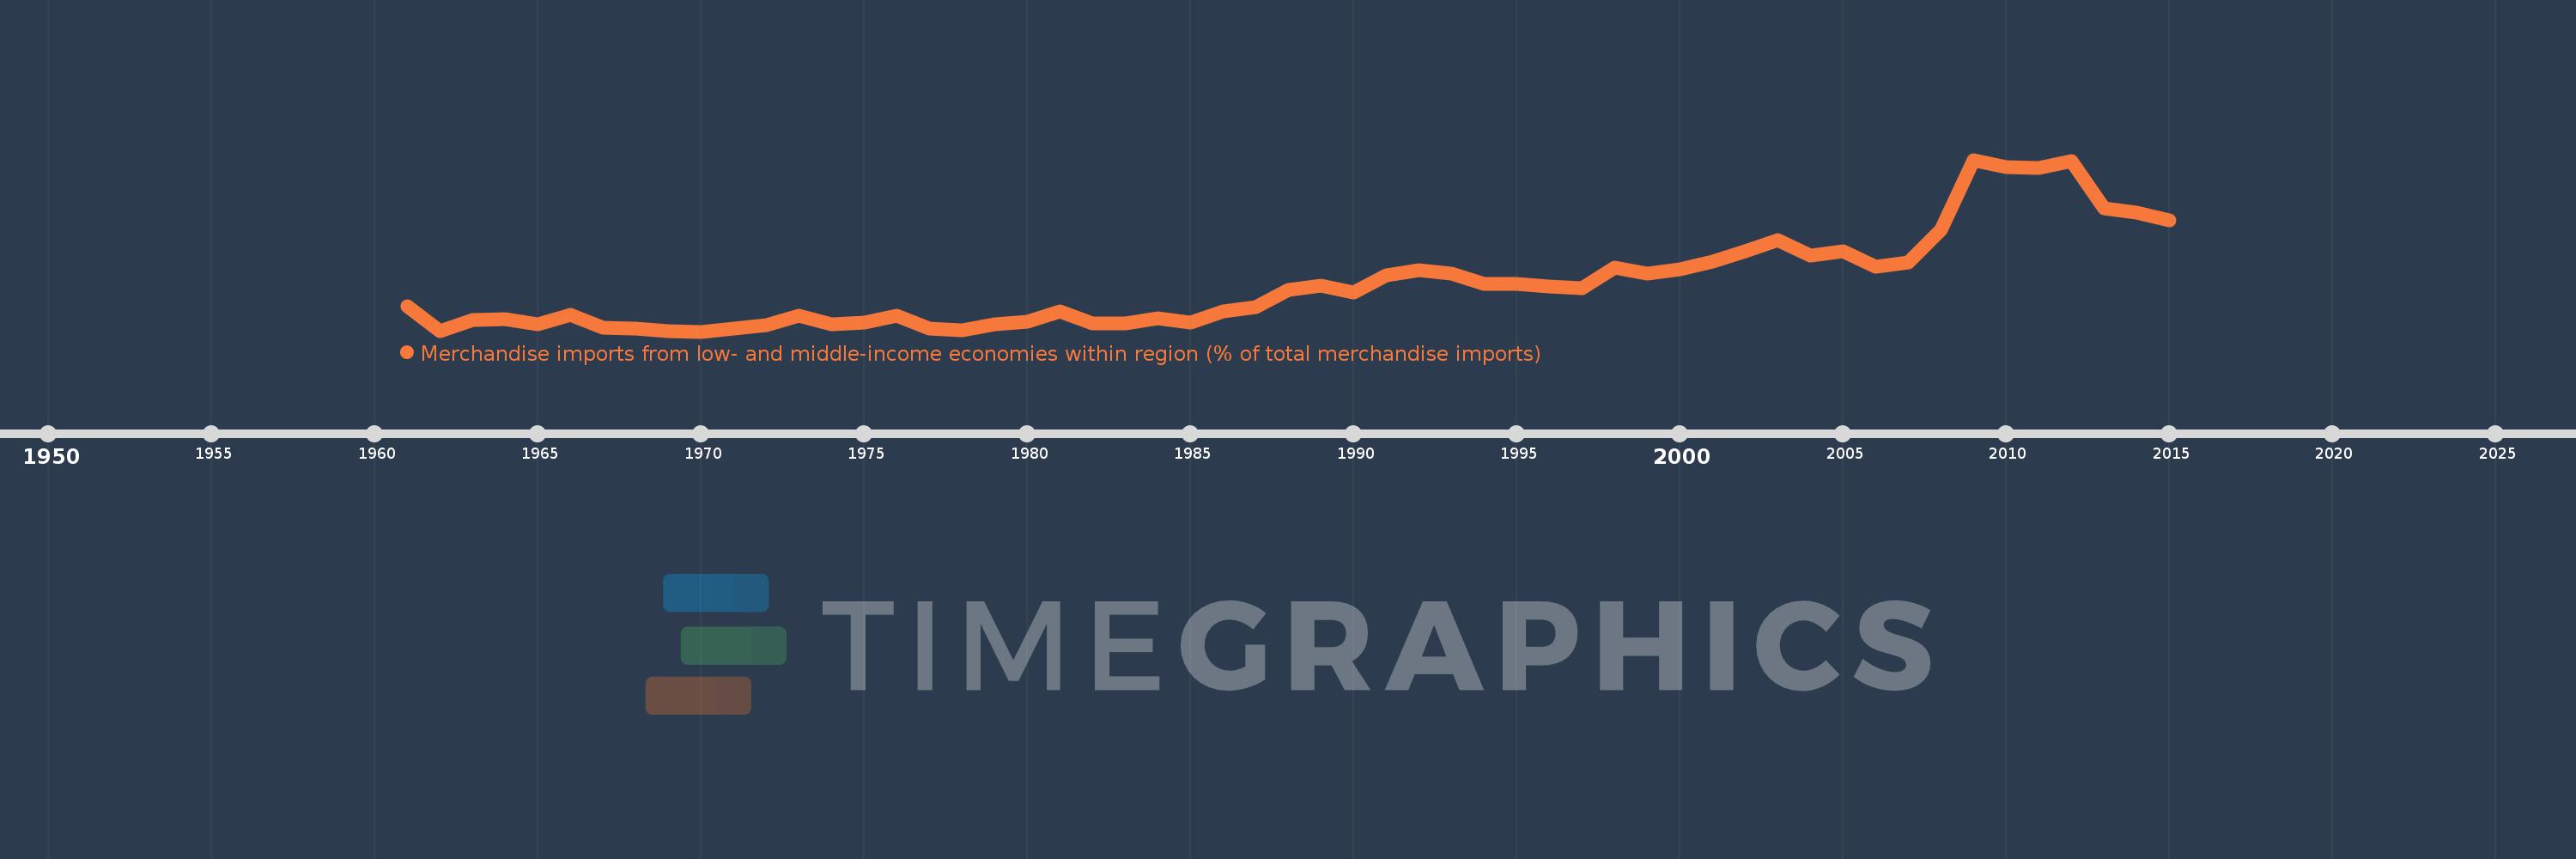
Small states
SST
false
2
1
Merchandise imports from low- and middle-income economies within region (% of total merchandise imports)
2015,2014,2013,2012,2011,2010,2009,2008,2007,2006,2005,2004,2003,2002,2001,2000,1999,1998,1997,1996,1995,1994,1993,1992,1991,1990,1989,1988,1987,1986,1985,1984,1983,1982,1981,1980,1979,1978,1977,1976,1975,1974,1973,1972,1971,1970,1969,1968,1967,1966,1965,1964,1963,1962,1961
This statistics in other country:
Timeline:
This timeline shows a graph from 1961 to 2015 of Small states. No data until 1960. Number of actual observations by date: 55.
Source name:
World Development Indicators
Source organization:
World Bank staff estimates based data from International Monetary Fund's Direction of Trade database.
Categories, topics:
Private Sector, Trade
Last updated:
apr 23, 2017
Indicators value changes by year
At the date of observation
Value
Absolute change
Change from previous value
jan 1, 1961
1.882
+1.882
0.0%
jan 1, 1962
1.216
-0.666
-35.41%
jan 1, 1963
1.513
+0.297
24.46%
jan 1, 1964
1.529
+0.016
1.05%
jan 1, 1965
1.404
-0.125
-8.15%
jan 1, 1966
1.647
+0.243
17.29%
jan 1, 1967
1.301
-0.347
-21.04%
jan 1, 1968
1.294
-0.007
-0.55%
jan 1, 1969
1.206
-0.088
-6.8%
jan 1, 1970
1.205
0.0
-0.04%
jan 1, 1971
1.292
+0.087
7.23%
jan 1, 1972
1.37
+0.077
5.99%
jan 1, 1973
1.625
+0.255
18.62%
jan 1, 1974
1.41
-0.214
-13.2%
jan 1, 1975
1.447
+0.036
2.58%
jan 1, 1976
1.624
+0.178
12.28%
jan 1, 1977
1.278
-0.346
-21.31%
jan 1, 1978
1.249
-0.029
-2.27%
jan 1, 1979
1.408
+0.159
12.72%
jan 1, 1980
1.463
+0.055
3.91%
jan 1, 1981
1.748
+0.285
19.45%
jan 1, 1982
1.416
-0.331
-18.96%
jan 1, 1983
1.419
+0.002
0.16%
jan 1, 1984
1.551
+0.133
9.36%
jan 1, 1985
1.438
-0.113
-7.31%
jan 1, 1986
1.736
+0.298
20.75%
jan 1, 1987
1.85
+0.113
6.53%
jan 1, 1988
2.309
+0.46
24.86%
jan 1, 1989
2.418
+0.109
4.7%
jan 1, 1990
2.252
-0.166
-6.87%
jan 1, 1991
2.707
+0.455
20.19%
jan 1, 1992
2.838
+0.131
4.84%
jan 1, 1993
2.757
-0.08
-2.83%
jan 1, 1994
2.473
-0.284
-10.32%
jan 1, 1995
2.476
+0.003
0.13%
jan 1, 1996
2.408
-0.068
-2.75%
jan 1, 1997
2.359
-0.049
-2.01%
jan 1, 1998
2.911
+0.552
23.39%
jan 1, 1999
2.746
-0.166
-5.69%
jan 1, 2000
2.861
+0.115
4.2%
jan 1, 2001
3.078
+0.217
7.59%
jan 1, 2002
3.345
+0.267
8.67%
jan 1, 2003
3.652
+0.308
9.2%
jan 1, 2004
3.239
-0.414
-11.33%
jan 1, 2005
3.346
+0.107
3.31%
jan 1, 2006
2.932
-0.414
-12.39%
jan 1, 2007
3.038
+0.107
3.64%
jan 1, 2008
3.924
+0.886
29.17%
jan 1, 2009
5.78
+1.855
47.28%
jan 1, 2010
5.579
-0.201
-3.47%
jan 1, 2011
5.571
-0.009
-0.16%
jan 1, 2012
5.738
+0.168
3.02%
jan 1, 2013
4.488
-1.25
-21.79%
jan 1, 2014
4.373
-0.115
-2.57%
jan 1, 2015
4.171
-0.202
-4.61%
Ranking of countries by current statistics by years


Comments: