29
/
en
AIzaSyAYiBZKx7MnpbEhh9jyipgxe19OcubqV5w
April 1, 2024
282579
Vietnam
VNM
true
2
1
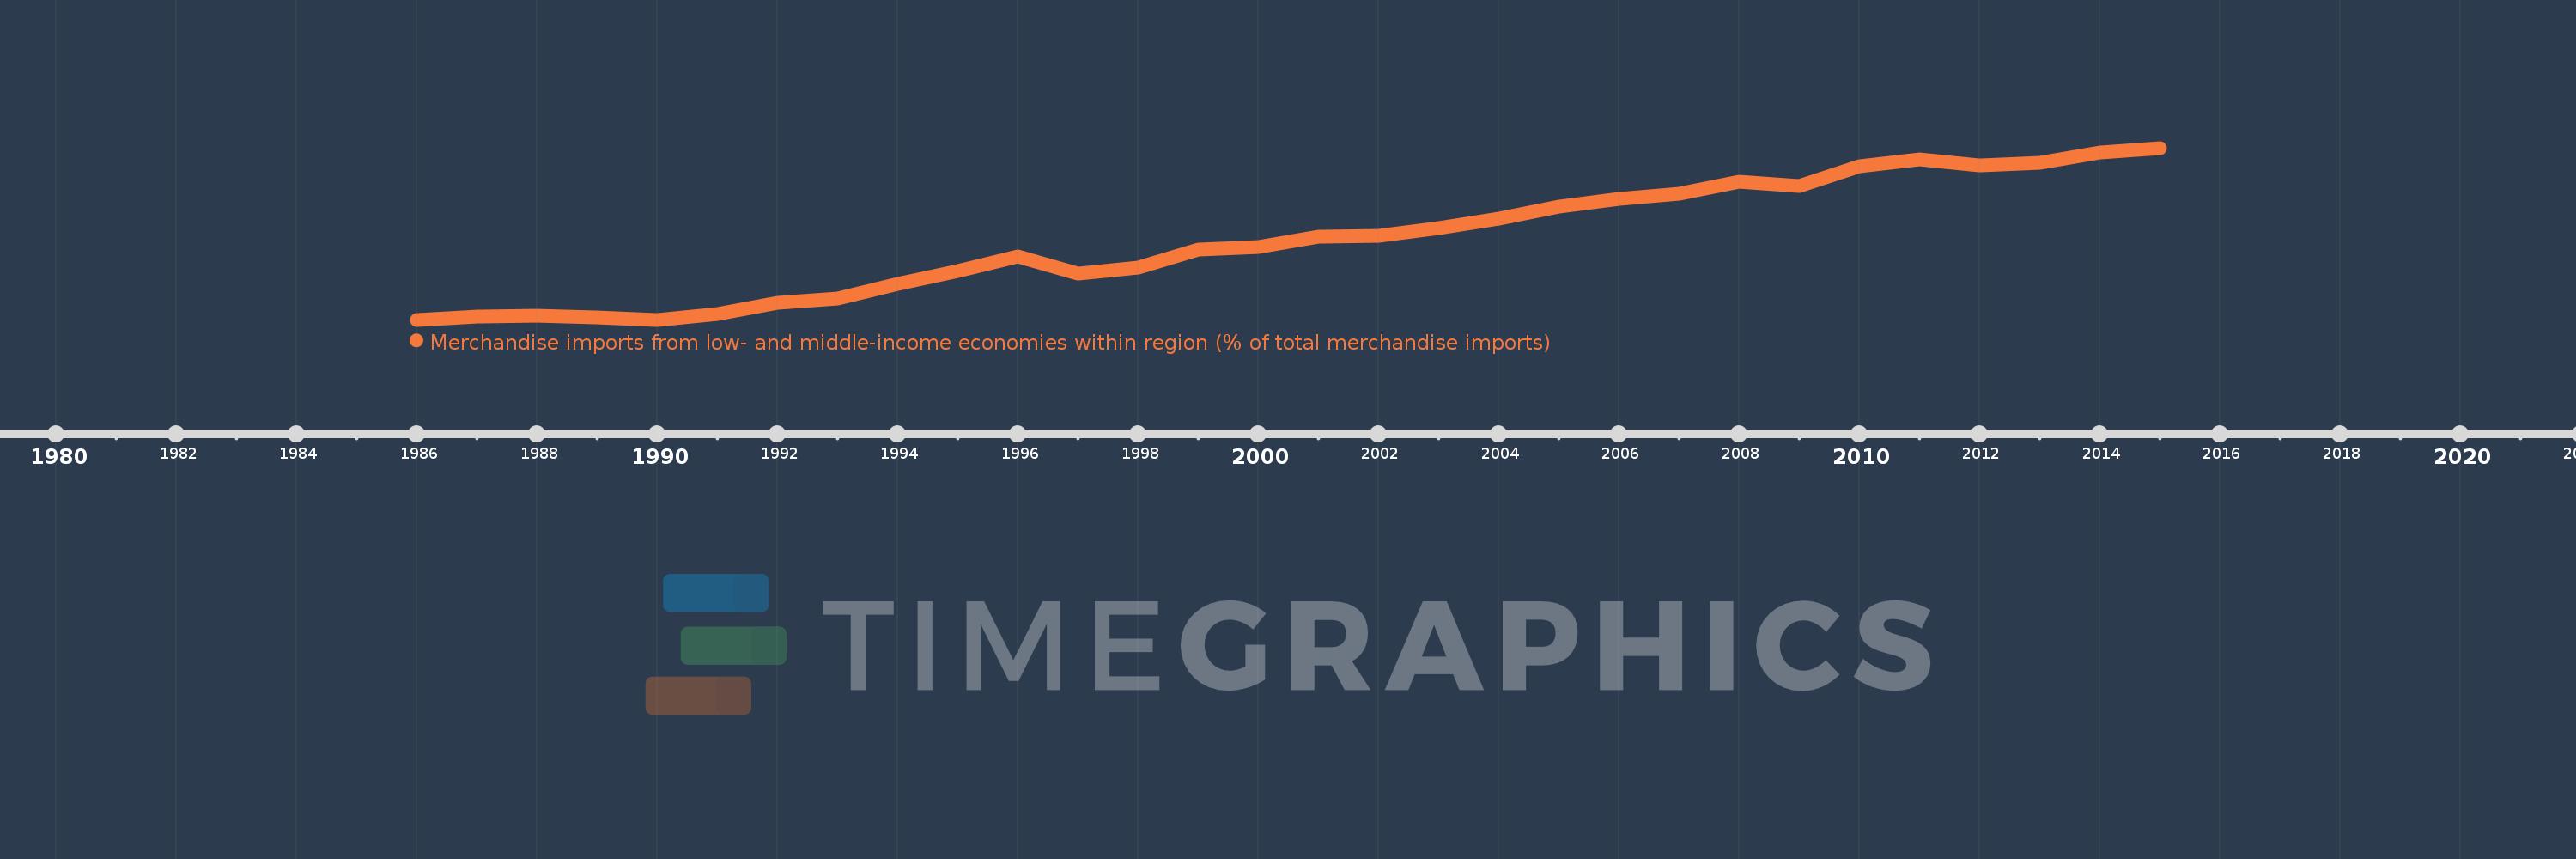
Merchandise imports from low- and middle-income economies within region (% of total merchandise imports)
2015,2014,2013,2012,2011,2010,2009,2008,2007,2006,2005,2004,2003,2002,2001,2000,1999,1998,1997,1996,1995,1994,1993,1992,1991,1990,1989,1988,1987,1986
This statistics in other country:
Timeline:
This timeline shows a graph from 1986 to 2015 of Vietnam. No data until 1985. Number of actual observations by date: 30.
Source name:
World Development Indicators
Source organization:
World Bank staff estimates based data from International Monetary Fund's Direction of Trade database.
Categories, topics:
Private Sector, Trade
Last updated:
apr 23, 2017
Indicators value changes by year
Maximum:
41.451
jan 1, 2015
At the date of observation
Value
Absolute change
Change from previous value
jan 1, 1986
0.364
+0.364
0.0%
jan 1, 1987
1.161
+0.797
219.2%
jan 1, 1988
1.331
+0.171
14.69%
jan 1, 1989
0.863
-0.468
-35.15%
jan 1, 1990
0.4
-0.464
-53.7%
jan 1, 1991
1.696
+1.297
324.33%
jan 1, 1992
4.366
+2.669
157.36%
jan 1, 1993
5.475
+1.109
25.41%
jan 1, 1994
8.927
+3.452
63.04%
jan 1, 1995
12.048
+3.121
34.97%
jan 1, 1996
15.573
+3.525
29.26%
jan 1, 1997
11.475
-4.097
-26.31%
jan 1, 1998
12.848
+1.373
11.96%
jan 1, 1999
17.136
+4.288
33.38%
jan 1, 2000
17.761
+0.625
3.65%
jan 1, 2001
20.196
+2.435
13.71%
jan 1, 2002
20.348
+0.152
0.75%
jan 1, 2003
22.255
+1.907
9.37%
jan 1, 2004
24.61
+2.355
10.58%
jan 1, 2005
27.354
+2.744
11.15%
jan 1, 2006
29.226
+1.871
6.84%
jan 1, 2007
30.438
+1.212
4.15%
jan 1, 2008
33.465
+3.028
9.95%
jan 1, 2009
32.413
-1.052
-3.14%
jan 1, 2010
37.176
+4.763
14.69%
jan 1, 2011
38.764
+1.588
4.27%
jan 1, 2012
37.245
-1.519
-3.92%
jan 1, 2013
37.839
+0.594
1.6%
jan 1, 2014
40.303
+2.464
6.51%
jan 1, 2015
41.451
+1.148
2.85%
Ranking of countries by current statistics by years


Comments: