29
/
en
AIzaSyAYiBZKx7MnpbEhh9jyipgxe19OcubqV5w
April 1, 2024
55722
Pre-demographic dividend
PRE
false
2
1
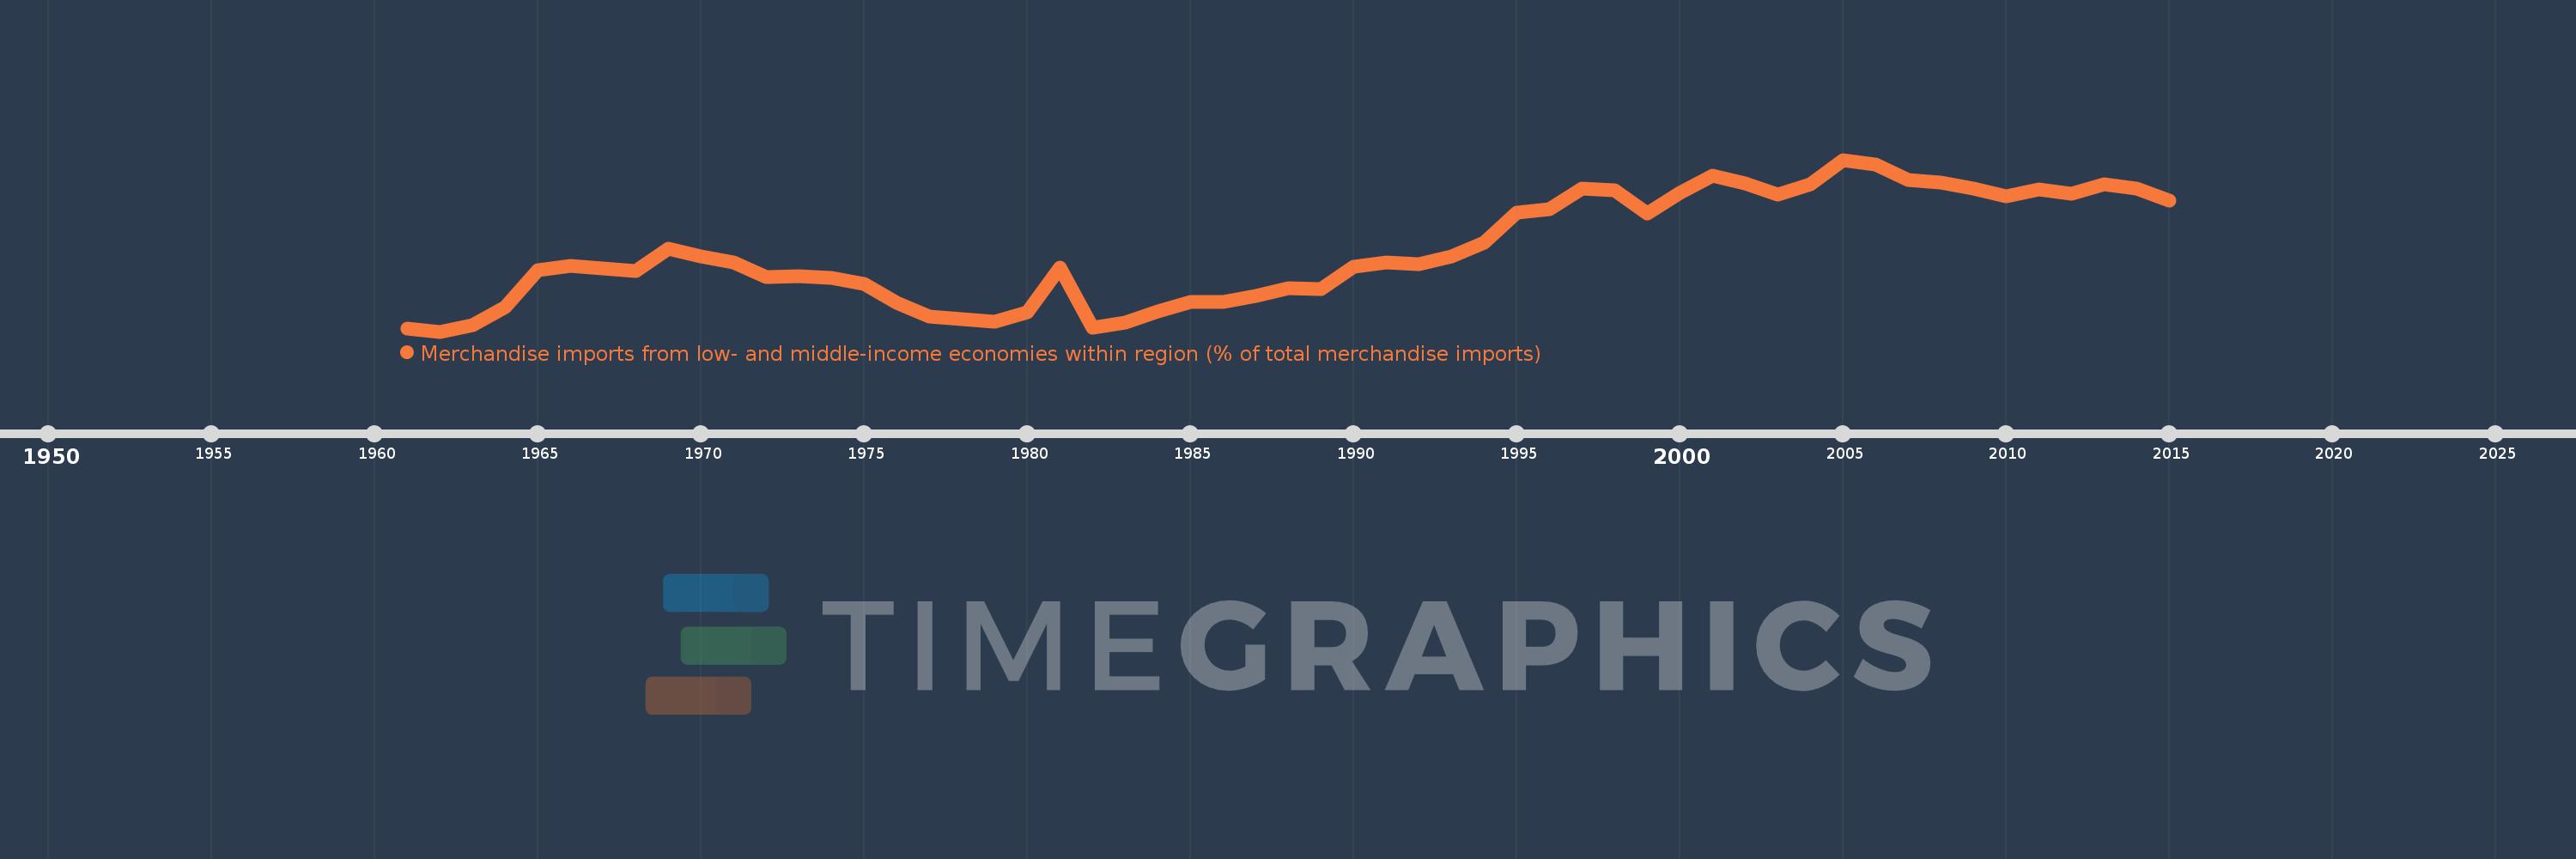
Merchandise imports from low- and middle-income economies within region (% of total merchandise imports)
2015,2014,2013,2012,2011,2010,2009,2008,2007,2006,2005,2004,2003,2002,2001,2000,1999,1998,1997,1996,1995,1994,1993,1992,1991,1990,1989,1988,1987,1986,1985,1984,1983,1982,1981,1980,1979,1978,1977,1976,1975,1974,1973,1972,1971,1970,1969,1968,1967,1966,1965,1964,1963,1962,1961
This statistics in other country:
Timeline:
This timeline shows a graph from 1961 to 2015 of Pre-demographic dividend. No data until 1960. Number of actual observations by date: 55.
Source name:
World Development Indicators
Source organization:
World Bank staff estimates based data from International Monetary Fund's Direction of Trade database.
Categories, topics:
Private Sector, Trade
Last updated:
apr 23, 2017
Indicators value changes by year
Maximum:
18.185
jan 1, 2005
At the date of observation
Value
Absolute change
Change from previous value
jan 1, 1961
3.078
+3.078
0.0%
jan 1, 1962
2.785
-0.293
-9.52%
jan 1, 1963
3.394
+0.61
21.89%
jan 1, 1964
5.005
+1.61
47.45%
jan 1, 1965
8.257
+3.252
64.98%
jan 1, 1966
8.664
+0.407
4.93%
jan 1, 1967
8.456
-0.207
-2.39%
jan 1, 1968
8.229
-0.227
-2.69%
jan 1, 1969
10.211
+1.982
24.08%
jan 1, 1970
9.488
-0.723
-7.08%
jan 1, 1971
8.951
-0.537
-5.66%
jan 1, 1972
7.712
-1.239
-13.84%
jan 1, 1973
7.735
+0.023
0.3%
jan 1, 1974
7.617
-0.118
-1.53%
jan 1, 1975
7.033
-0.583
-7.66%
jan 1, 1976
5.366
-1.667
-23.71%
jan 1, 1977
4.159
-1.207
-22.49%
jan 1, 1978
3.892
-0.268
-6.44%
jan 1, 1979
3.675
-0.216
-5.56%
jan 1, 1980
4.547
+0.872
23.71%
jan 1, 1981
8.497
+3.95
86.88%
jan 1, 1982
3.118
-5.379
-63.31%
jan 1, 1983
3.6
+0.482
15.47%
jan 1, 1984
4.602
+1.002
27.83%
jan 1, 1985
5.432
+0.829
18.02%
jan 1, 1986
5.437
+0.005
0.1%
jan 1, 1987
5.983
+0.546
10.04%
jan 1, 1988
6.685
+0.702
11.74%
jan 1, 1989
6.594
-0.091
-1.36%
jan 1, 1990
8.598
+2.004
30.39%
jan 1, 1991
8.992
+0.394
4.59%
jan 1, 1992
8.862
-0.13
-1.44%
jan 1, 1993
9.53
+0.668
7.54%
jan 1, 1994
10.765
+1.235
12.96%
jan 1, 1995
13.436
+2.671
24.81%
jan 1, 1996
13.735
+0.299
2.22%
jan 1, 1997
15.591
+1.856
13.52%
jan 1, 1998
15.426
-0.165
-1.06%
jan 1, 1999
13.336
-2.091
-13.55%
jan 1, 2000
15.256
+1.92
14.4%
jan 1, 2001
16.794
+1.538
10.08%
jan 1, 2002
16.074
-0.719
-4.28%
jan 1, 2003
15.057
-1.017
-6.33%
jan 1, 2004
15.995
+0.938
6.23%
jan 1, 2005
18.185
+2.19
13.69%
jan 1, 2006
17.753
-0.432
-2.37%
jan 1, 2007
16.399
-1.354
-7.63%
jan 1, 2008
16.179
-0.22
-1.34%
jan 1, 2009
15.602
-0.577
-3.57%
jan 1, 2010
14.913
-0.69
-4.42%
jan 1, 2011
15.506
+0.593
3.98%
jan 1, 2012
15.126
-0.38
-2.45%
jan 1, 2013
16.026
+0.9
5.95%
jan 1, 2014
15.589
-0.437
-2.72%
jan 1, 2015
14.496
-1.093
-7.01%
Ranking of countries by current statistics by years


Comments: