29
/
en
AIzaSyAYiBZKx7MnpbEhh9jyipgxe19OcubqV5w
April 1, 2024
189253
Maldives
MDV
true
2
1
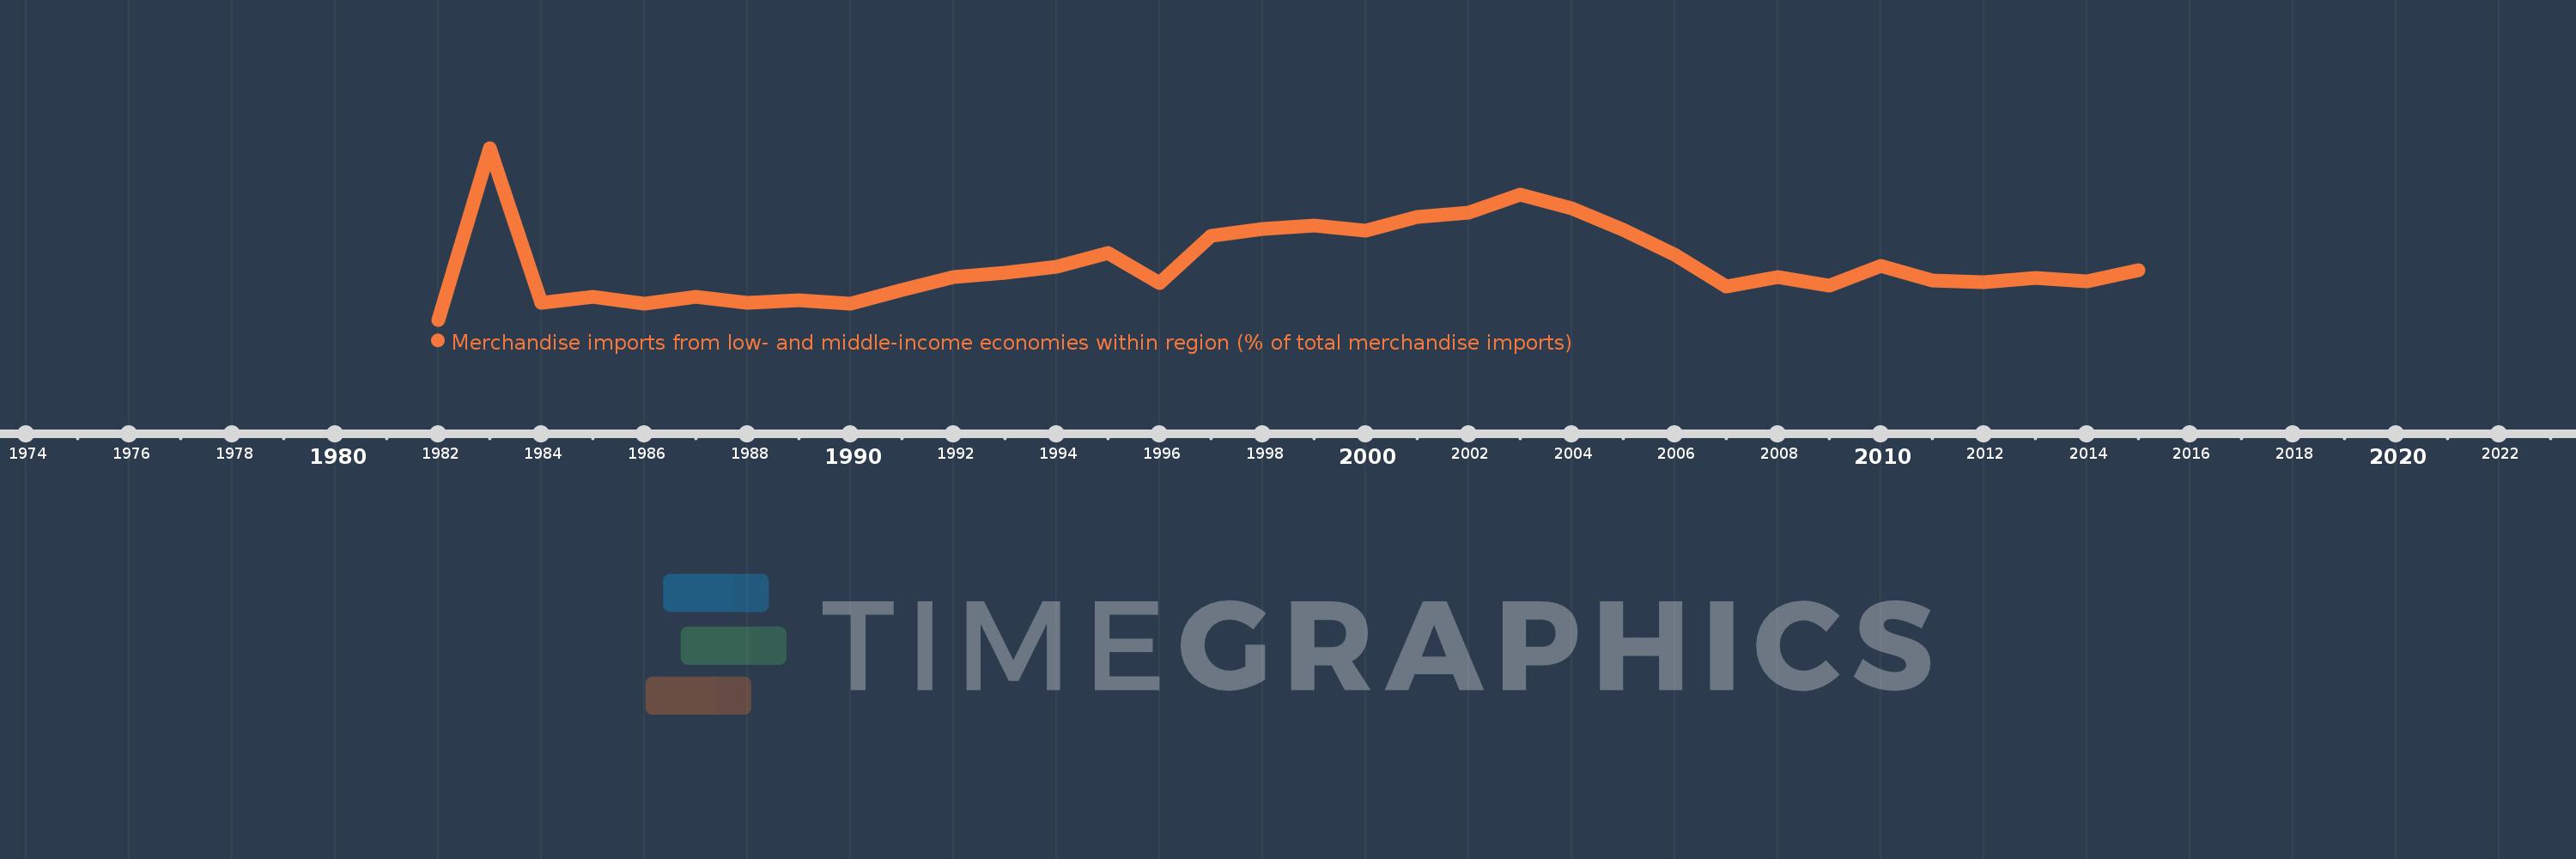
Merchandise imports from low- and middle-income economies within region (% of total merchandise imports)
2015,2014,2013,2012,2011,2010,2009,2008,2007,2006,2005,2004,2003,2002,2001,2000,1999,1998,1997,1996,1995,1994,1993,1992,1991,1990,1989,1988,1987,1986,1985,1984,1983,1982
This statistics in other country:
Timeline:
This timeline shows a graph from 1982 to 2015 of Maldives. No data until 1981. Number of actual observations by date: 34.
Source name:
World Development Indicators
Source organization:
World Bank staff estimates based data from International Monetary Fund's Direction of Trade database.
Categories, topics:
Private Sector, Trade
Last updated:
apr 23, 2017
Indicators value changes by year
Maximum:
33.305
jan 1, 1983
At the date of observation
Value
Absolute change
Change from previous value
jan 1, 1982
7.699
+7.699
0.0%
jan 1, 1983
33.305
+25.607
332.6%
jan 1, 1984
10.264
-23.041
-69.18%
jan 1, 1985
11.153
+0.889
8.66%
jan 1, 1986
10.035
-1.118
-10.02%
jan 1, 1987
11.069
+1.033
10.3%
jan 1, 1988
10.169
-0.9
-8.13%
jan 1, 1989
10.601
+0.432
4.25%
jan 1, 1990
10.066
-0.535
-5.05%
jan 1, 1991
12.154
+2.088
20.74%
jan 1, 1992
14.058
+1.904
15.66%
jan 1, 1993
14.652
+0.594
4.22%
jan 1, 1994
15.631
+0.979
6.68%
jan 1, 1995
17.609
+1.978
12.65%
jan 1, 1996
13.19
-4.419
-25.09%
jan 1, 1997
20.189
+6.999
53.06%
jan 1, 1998
21.265
+1.076
5.33%
jan 1, 1999
21.802
+0.537
2.53%
jan 1, 2000
20.986
-0.817
-3.75%
jan 1, 2001
23.029
+2.043
9.74%
jan 1, 2002
23.704
+0.675
2.93%
jan 1, 2003
26.353
+2.649
11.17%
jan 1, 2004
24.259
-2.094
-7.95%
jan 1, 2005
21.162
-3.097
-12.77%
jan 1, 2006
17.362
-3.8
-17.96%
jan 1, 2007
12.657
-4.704
-27.1%
jan 1, 2008
13.999
+1.342
10.6%
jan 1, 2009
12.728
-1.271
-9.08%
jan 1, 2010
15.706
+2.978
23.39%
jan 1, 2011
13.574
-2.132
-13.57%
jan 1, 2012
13.265
-0.309
-2.28%
jan 1, 2013
13.916
+0.651
4.91%
jan 1, 2014
13.391
-0.525
-3.77%
jan 1, 2015
15.085
+1.694
12.65%
Ranking of countries by current statistics by years


Comments: