29
/
en
AIzaSyAYiBZKx7MnpbEhh9jyipgxe19OcubqV5w
April 1, 2024
40111
IDA total
IDA
false
2
1
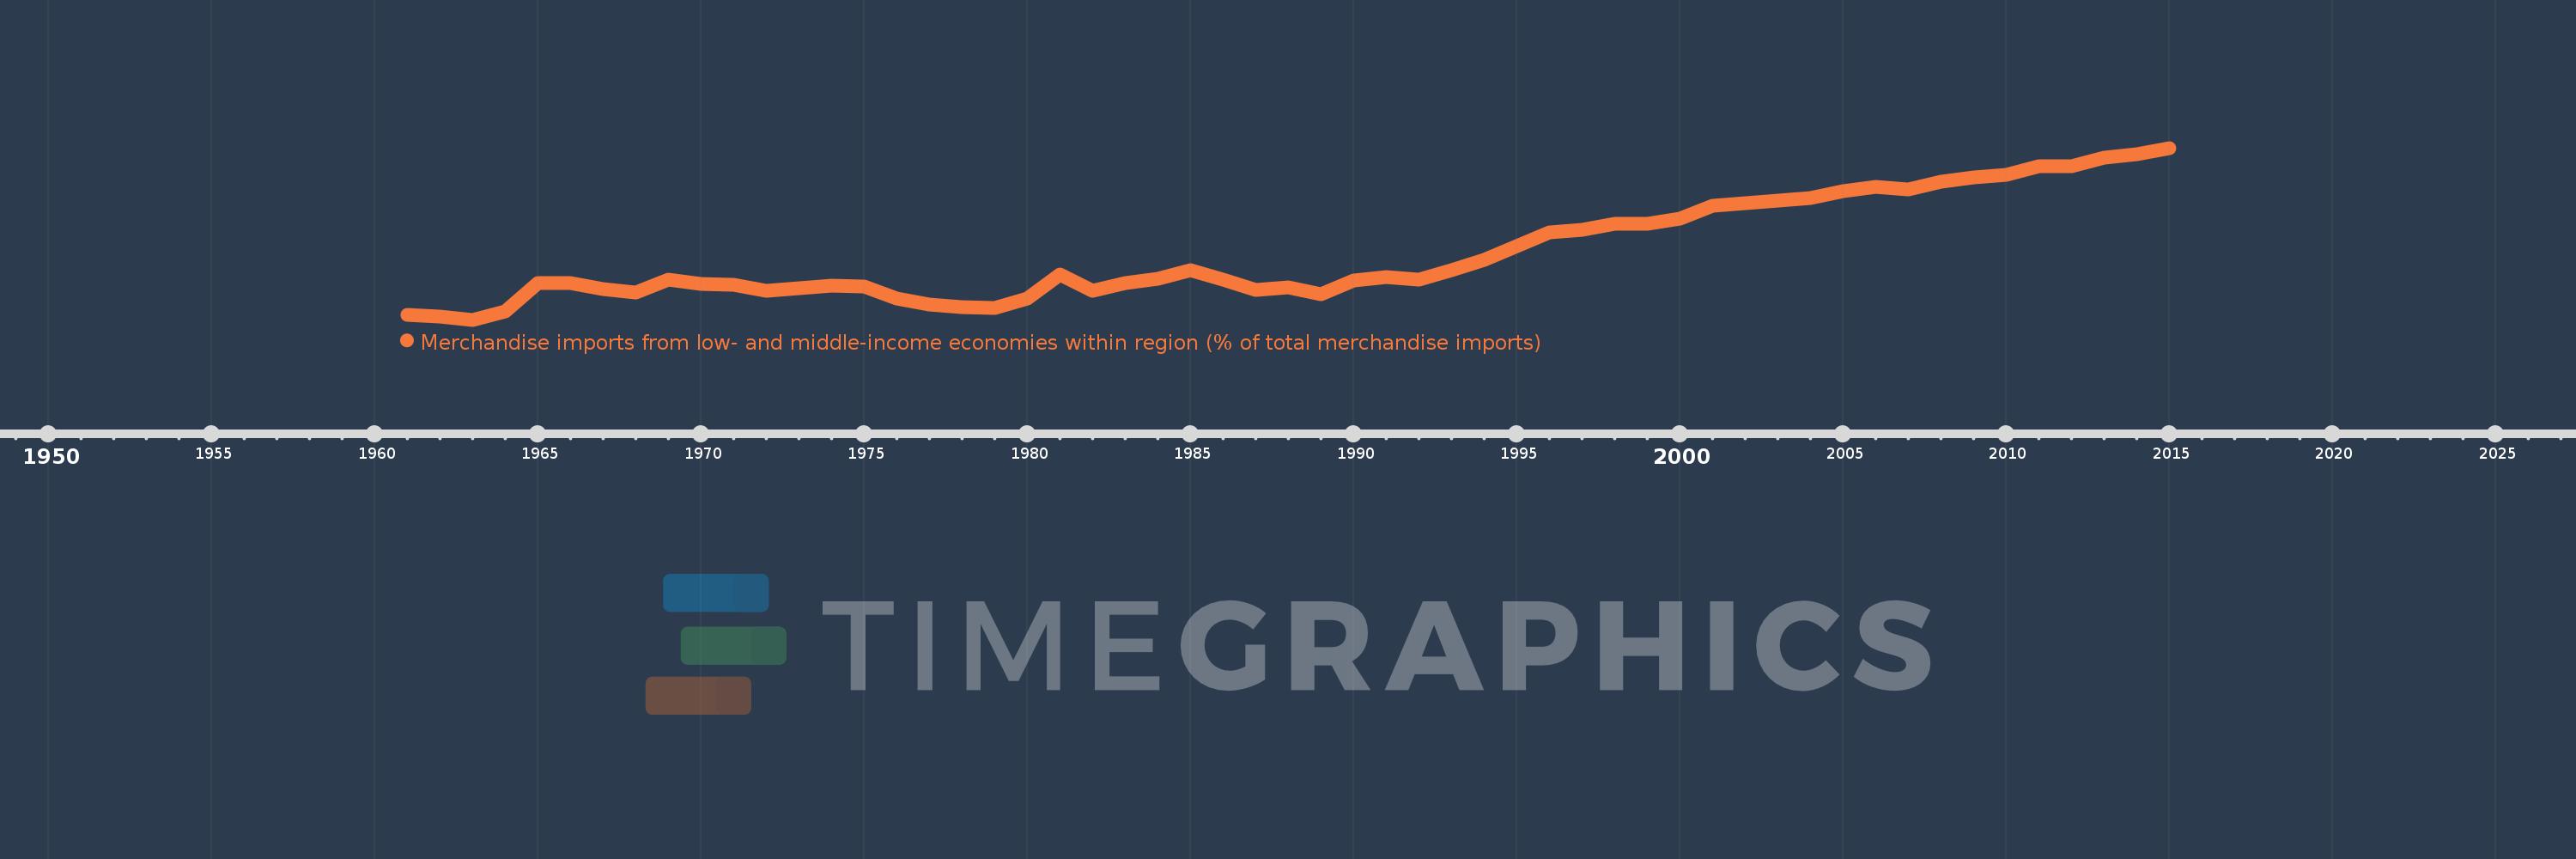
Merchandise imports from low- and middle-income economies within region (% of total merchandise imports)
2015,2014,2013,2012,2011,2010,2009,2008,2007,2006,2005,2004,2003,2002,2001,2000,1999,1998,1997,1996,1995,1994,1993,1992,1991,1990,1989,1988,1987,1986,1985,1984,1983,1982,1981,1980,1979,1978,1977,1976,1975,1974,1973,1972,1971,1970,1969,1968,1967,1966,1965,1964,1963,1962,1961
This statistics in other country:
Timeline:
This timeline shows a graph from 1961 to 2015 of IDA total. No data until 1960. Number of actual observations by date: 55.
Source name:
World Development Indicators
Source organization:
World Bank staff estimates based data from International Monetary Fund's Direction of Trade database.
Categories, topics:
Private Sector, Trade
Last updated:
apr 23, 2017
Indicators value changes by year
Maximum:
25.007
jan 1, 2015
At the date of observation
Value
Absolute change
Change from previous value
jan 1, 1961
4.974
+4.974
0.0%
jan 1, 1962
4.729
-0.245
-4.93%
jan 1, 1963
4.362
-0.367
-7.76%
jan 1, 1964
5.316
+0.954
21.88%
jan 1, 1965
8.757
+3.441
64.74%
jan 1, 1966
8.737
-0.02
-0.23%
jan 1, 1967
8.024
-0.713
-8.17%
jan 1, 1968
7.639
-0.385
-4.8%
jan 1, 1969
9.194
+1.555
20.36%
jan 1, 1970
8.692
-0.502
-5.46%
jan 1, 1971
8.523
-0.169
-1.94%
jan 1, 1972
7.892
-0.632
-7.41%
jan 1, 1973
8.133
+0.241
3.05%
jan 1, 1974
8.491
+0.359
4.41%
jan 1, 1975
8.388
-0.104
-1.22%
jan 1, 1976
6.914
-1.474
-17.57%
jan 1, 1977
6.18
-0.734
-10.61%
jan 1, 1978
5.88
-0.3
-4.86%
jan 1, 1979
5.754
-0.126
-2.14%
jan 1, 1980
6.908
+1.154
20.06%
jan 1, 1981
9.763
+2.855
41.32%
jan 1, 1982
7.861
-1.902
-19.48%
jan 1, 1983
8.783
+0.922
11.73%
jan 1, 1984
9.244
+0.461
5.25%
jan 1, 1985
10.338
+1.094
11.83%
jan 1, 1986
9.225
-1.113
-10.77%
jan 1, 1987
7.925
-1.3
-14.09%
jan 1, 1988
8.285
+0.36
4.54%
jan 1, 1989
7.398
-0.887
-10.7%
jan 1, 1990
9.087
+1.688
22.82%
jan 1, 1991
9.455
+0.369
4.06%
jan 1, 1992
9.202
-0.253
-2.68%
jan 1, 1993
10.268
+1.065
11.58%
jan 1, 1994
11.527
+1.259
12.26%
jan 1, 1995
13.214
+1.687
14.64%
jan 1, 1996
14.835
+1.622
12.27%
jan 1, 1997
15.201
+0.366
2.47%
jan 1, 1998
15.925
+0.724
4.76%
jan 1, 1999
15.845
-0.08
-0.5%
jan 1, 2000
16.495
+0.65
4.1%
jan 1, 2001
18.09
+1.595
9.67%
jan 1, 2002
18.382
+0.292
1.61%
jan 1, 2003
18.645
+0.263
1.43%
jan 1, 2004
18.997
+0.352
1.89%
jan 1, 2005
19.764
+0.767
4.04%
jan 1, 2006
20.375
+0.611
3.09%
jan 1, 2007
20.045
-0.33
-1.62%
jan 1, 2008
20.928
+0.883
4.41%
jan 1, 2009
21.428
+0.499
2.39%
jan 1, 2010
21.745
+0.318
1.48%
jan 1, 2011
22.768
+1.023
4.7%
jan 1, 2012
22.847
+0.079
0.35%
jan 1, 2013
23.834
+0.987
4.32%
jan 1, 2014
24.221
+0.387
1.62%
jan 1, 2015
25.007
+0.786
3.25%
Ranking of countries by current statistics by years


Comments: