29
/
en
AIzaSyAYiBZKx7MnpbEhh9jyipgxe19OcubqV5w
April 1, 2024
213255
Nigeria
NGA
true
2
1
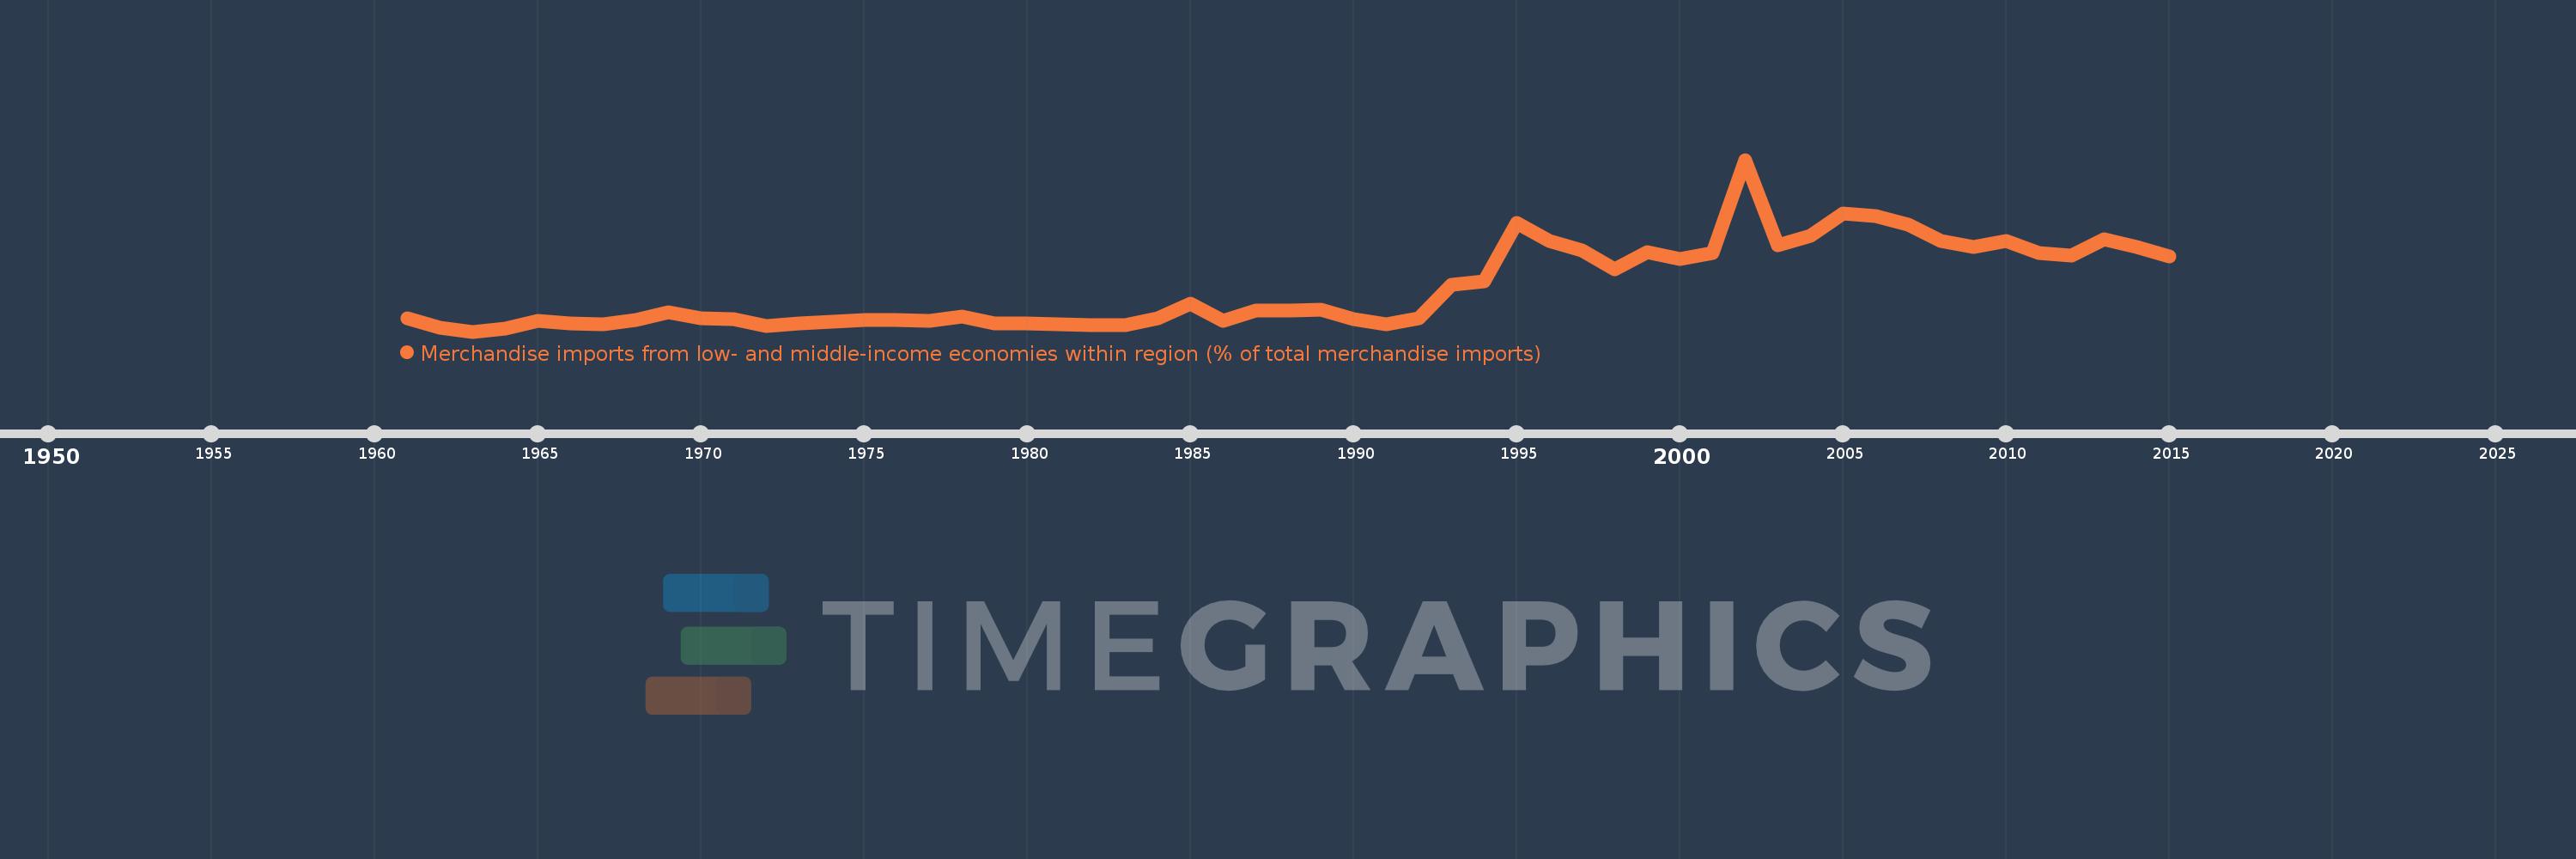
Merchandise imports from low- and middle-income economies within region (% of total merchandise imports)
2015,2014,2013,2012,2011,2010,2009,2008,2007,2006,2005,2004,2003,2002,2001,2000,1999,1998,1997,1996,1995,1994,1993,1992,1991,1990,1989,1988,1987,1986,1985,1984,1983,1982,1980,1979,1978,1977,1976,1975,1974,1973,1972,1971,1970,1969,1968,1967,1966,1965,1964,1963,1962,1961
This statistics in other country:
Timeline:
This timeline shows a graph from 1961 to 2015 of Nigeria. No data until 1960. Number of actual observations by date: 54.
Source name:
World Development Indicators
Source organization:
World Bank staff estimates based data from International Monetary Fund's Direction of Trade database.
Categories, topics:
Private Sector, Trade
Last updated:
apr 23, 2017
Indicators value changes by year
At the date of observation
Value
Absolute change
Change from previous value
jan 1, 1961
0.78
+0.78
0.0%
jan 1, 1962
0.322
-0.458
-58.76%
jan 1, 1963
0.123
-0.198
-61.64%
jan 1, 1964
0.293
+0.17
137.54%
jan 1, 1965
0.675
+0.382
130.37%
jan 1, 1966
0.535
-0.14
-20.76%
jan 1, 1967
0.474
-0.061
-11.43%
jan 1, 1968
0.718
+0.245
51.62%
jan 1, 1969
1.093
+0.375
52.17%
jan 1, 1970
0.819
-0.274
-25.04%
jan 1, 1971
0.765
-0.054
-6.63%
jan 1, 1972
0.424
-0.341
-44.6%
jan 1, 1973
0.525
+0.101
23.86%
jan 1, 1974
0.623
+0.098
18.72%
jan 1, 1975
0.717
+0.094
15.1%
jan 1, 1976
0.711
-0.006
-0.86%
jan 1, 1977
0.671
-0.04
-5.67%
jan 1, 1978
0.874
+0.203
30.25%
jan 1, 1979
0.547
-0.327
-37.39%
jan 1, 1980
0.53
-0.018
-3.21%
jan 1, 1982
0.439
-0.09
-17.04%
jan 1, 1983
0.465
+0.025
5.75%
jan 1, 1984
0.814
+0.349
75.21%
jan 1, 1985
1.525
+0.711
87.38%
jan 1, 1986
0.68
-0.846
-55.45%
jan 1, 1987
1.208
+0.528
77.75%
jan 1, 1988
1.208
0.0
0.0%
jan 1, 1989
1.219
+0.011
0.89%
jan 1, 1990
0.746
-0.472
-38.75%
jan 1, 1991
0.473
-0.273
-36.58%
jan 1, 1992
0.794
+0.321
67.83%
jan 1, 1993
2.511
+1.716
216.04%
jan 1, 1994
2.67
+0.159
6.32%
jan 1, 1995
5.653
+2.984
111.77%
jan 1, 1996
4.738
-0.915
-16.18%
jan 1, 1997
4.251
-0.487
-10.28%
jan 1, 1998
3.301
-0.951
-22.36%
jan 1, 1999
4.181
+0.881
26.68%
jan 1, 2000
3.832
-0.349
-8.34%
jan 1, 2001
4.11
+0.277
7.23%
jan 1, 2002
8.852
+4.742
115.4%
jan 1, 2003
4.493
-4.359
-49.24%
jan 1, 2004
4.977
+0.484
10.77%
jan 1, 2005
6.108
+1.131
22.73%
jan 1, 2006
6.009
-0.099
-1.61%
jan 1, 2007
5.543
-0.467
-7.76%
jan 1, 2008
4.733
-0.809
-14.6%
jan 1, 2009
4.411
-0.323
-6.82%
jan 1, 2010
4.729
+0.318
7.21%
jan 1, 2011
4.132
-0.597
-12.62%
jan 1, 2012
3.966
-0.166
-4.02%
jan 1, 2013
4.836
+0.87
21.95%
jan 1, 2014
4.427
-0.409
-8.45%
jan 1, 2015
3.962
-0.465
-10.5%
Ranking of countries by current statistics by years


Comments: