29
/
en
AIzaSyAYiBZKx7MnpbEhh9jyipgxe19OcubqV5w
April 1, 2024
216730
Pakistan
PAK
true
2
1
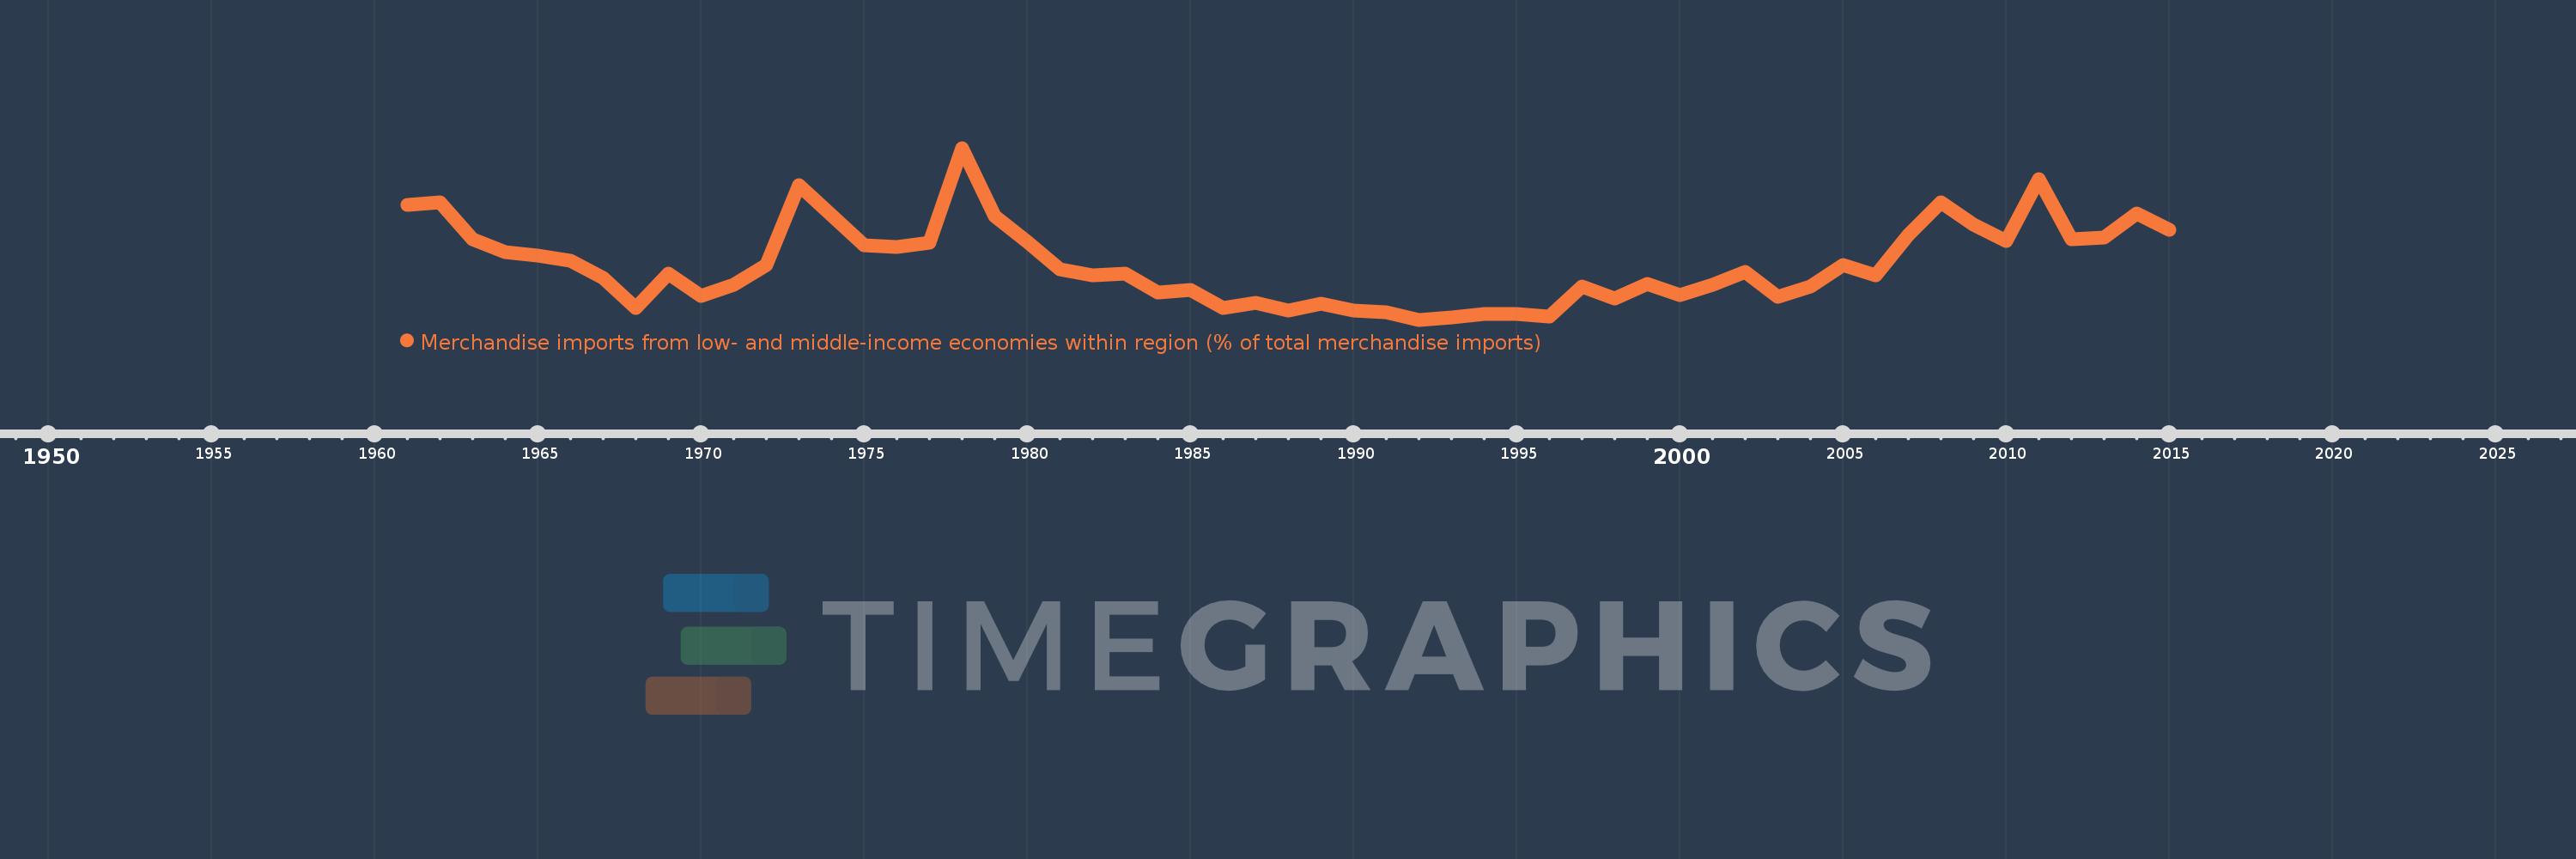
Merchandise imports from low- and middle-income economies within region (% of total merchandise imports)
2015,2014,2013,2012,2011,2010,2009,2008,2007,2006,2005,2004,2003,2002,2001,2000,1999,1998,1997,1996,1995,1994,1993,1992,1991,1990,1989,1988,1987,1986,1985,1984,1983,1982,1981,1980,1979,1978,1977,1976,1975,1974,1973,1972,1971,1970,1969,1968,1967,1966,1965,1964,1963,1962,1961
This statistics in other country:
Timeline:
This timeline shows a graph from 1961 to 2015 of Pakistan. No data until 1960. Number of actual observations by date: 55.
Source name:
World Development Indicators
Source organization:
World Bank staff estimates based data from International Monetary Fund's Direction of Trade database.
Categories, topics:
Private Sector, Trade
Last updated:
apr 23, 2017
Indicators value changes by year
At the date of observation
Value
Absolute change
Change from previous value
jan 1, 1961
5.468
+5.468
0.0%
jan 1, 1962
5.538
+0.07
1.27%
jan 1, 1963
4.285
-1.253
-22.62%
jan 1, 1964
3.816
-0.469
-10.94%
jan 1, 1965
3.7
-0.117
-3.05%
jan 1, 1966
3.536
-0.164
-4.42%
jan 1, 1967
2.925
-0.611
-17.29%
jan 1, 1968
1.903
-1.021
-34.92%
jan 1, 1969
3.071
+1.168
61.34%
jan 1, 1970
2.304
-0.767
-24.97%
jan 1, 1971
2.713
+0.409
17.76%
jan 1, 1972
3.39
+0.676
24.93%
jan 1, 1973
6.154
+2.764
81.53%
jan 1, 1974
5.116
-1.038
-16.86%
jan 1, 1975
4.075
-1.041
-20.35%
jan 1, 1976
4.007
-0.068
-1.67%
jan 1, 1977
4.157
+0.15
3.74%
jan 1, 1978
7.426
+3.269
78.64%
jan 1, 1979
5.082
-2.344
-31.56%
jan 1, 1980
4.177
-0.905
-17.8%
jan 1, 1981
3.238
-0.939
-22.48%
jan 1, 1982
3.012
-0.227
-7.0%
jan 1, 1983
3.09
+0.078
2.6%
jan 1, 1984
2.426
-0.664
-21.5%
jan 1, 1985
2.513
+0.087
3.6%
jan 1, 1986
1.895
-0.618
-24.57%
jan 1, 1987
2.068
+0.172
9.09%
jan 1, 1988
1.806
-0.262
-12.65%
jan 1, 1989
2.045
+0.239
13.25%
jan 1, 1990
1.811
-0.234
-11.46%
jan 1, 1991
1.736
-0.075
-4.16%
jan 1, 1992
1.492
-0.244
-14.05%
jan 1, 1993
1.569
+0.077
5.15%
jan 1, 1994
1.682
+0.114
7.25%
jan 1, 1995
1.695
+0.012
0.73%
jan 1, 1996
1.602
-0.093
-5.46%
jan 1, 1997
2.642
+1.039
64.87%
jan 1, 1998
2.238
-0.404
-15.29%
jan 1, 1999
2.733
+0.495
22.11%
jan 1, 2000
2.331
-0.402
-14.71%
jan 1, 2001
2.714
+0.384
16.47%
jan 1, 2002
3.159
+0.444
16.37%
jan 1, 2003
2.299
-0.859
-27.2%
jan 1, 2004
2.652
+0.353
15.33%
jan 1, 2005
3.376
+0.724
27.31%
jan 1, 2006
3.012
-0.364
-10.78%
jan 1, 2007
4.413
+1.4
46.49%
jan 1, 2008
5.547
+1.134
25.7%
jan 1, 2009
4.789
-0.757
-13.66%
jan 1, 2010
4.209
-0.581
-12.12%
jan 1, 2011
6.362
+2.154
51.17%
jan 1, 2012
4.279
-2.084
-32.75%
jan 1, 2013
4.326
+0.047
1.1%
jan 1, 2014
5.15
+0.824
19.04%
jan 1, 2015
4.589
-0.561
-10.89%
Ranking of countries by current statistics by years


Comments: