29
/
en
AIzaSyAYiBZKx7MnpbEhh9jyipgxe19OcubqV5w
April 1, 2024
287497
Zimbabwe
ZWE
true
2
1
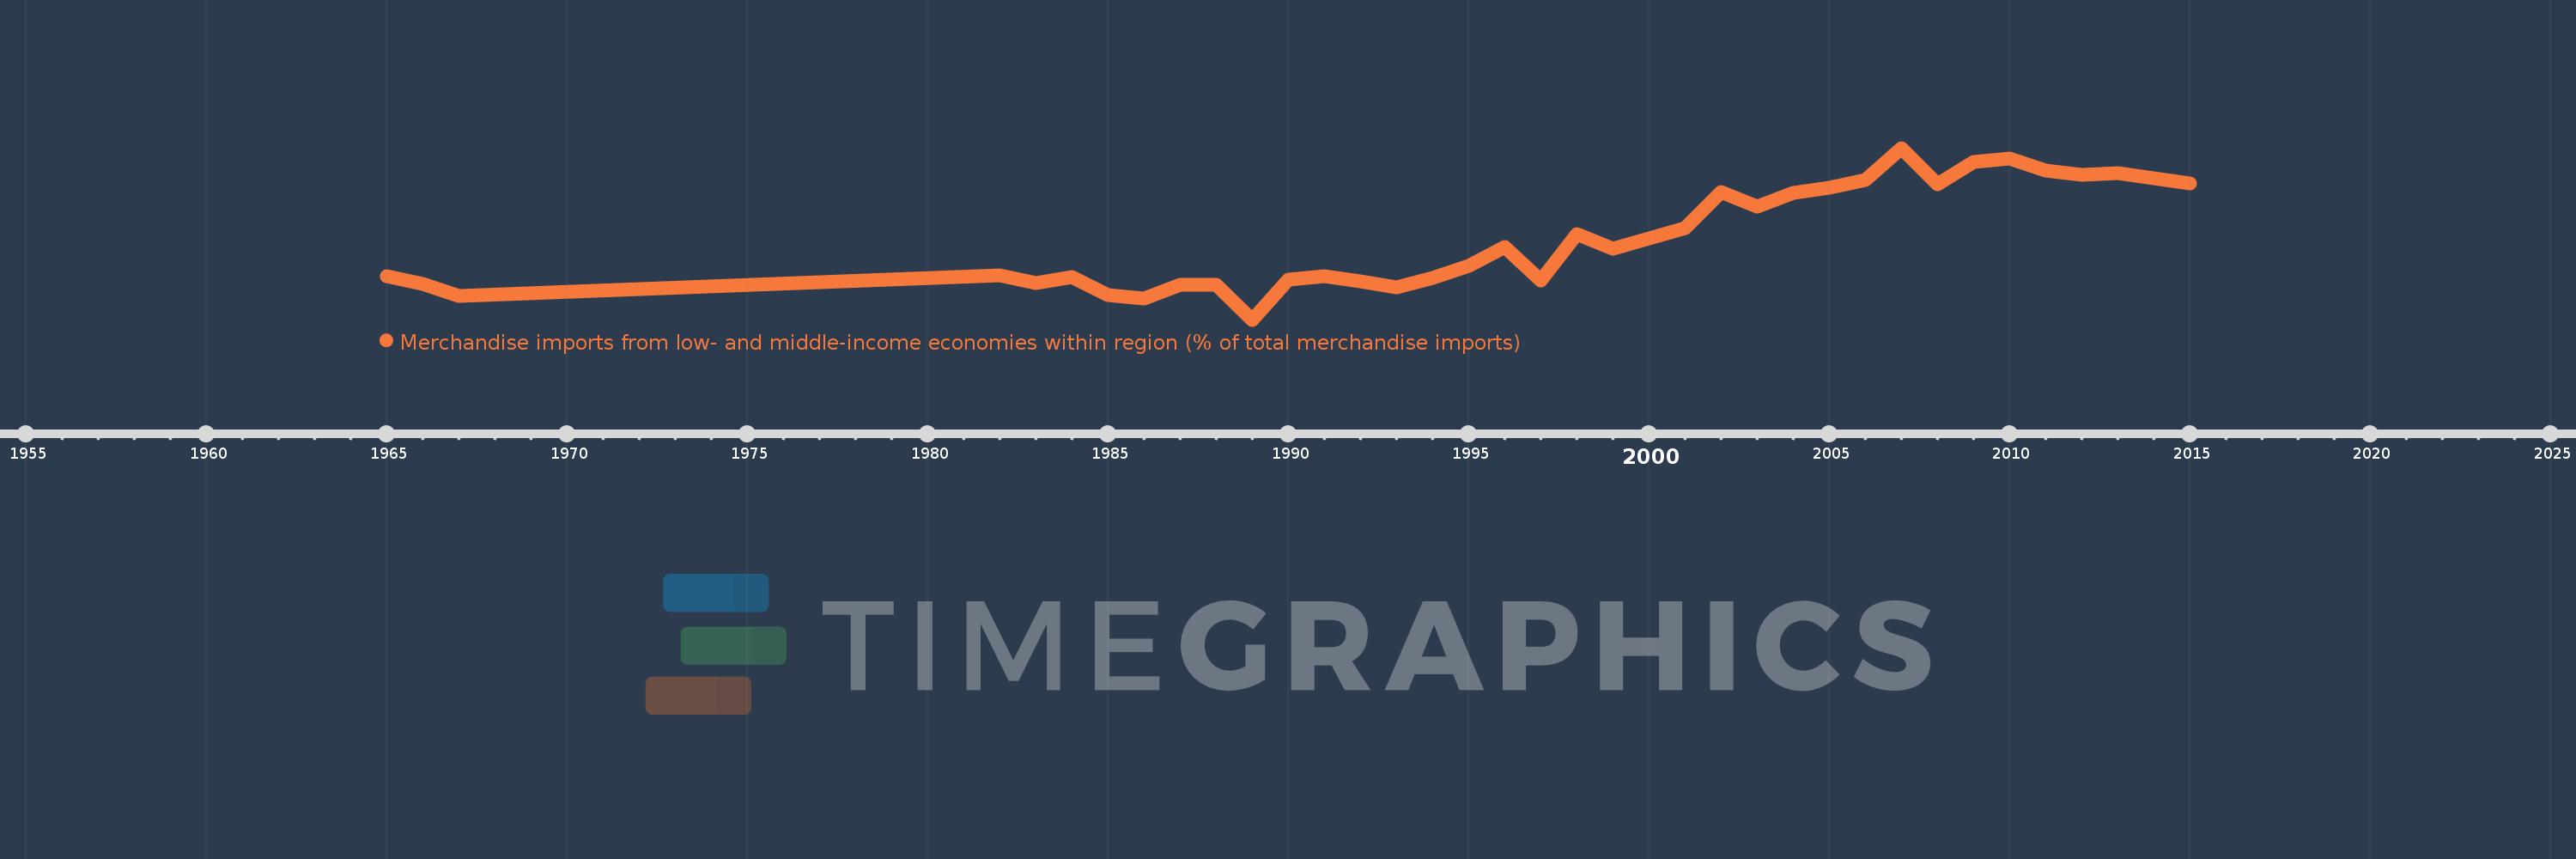
Merchandise imports from low- and middle-income economies within region (% of total merchandise imports)
2015,2014,2013,2012,2011,2010,2009,2008,2007,2006,2005,2004,2003,2002,2001,2000,1999,1998,1997,1996,1995,1994,1993,1992,1991,1990,1989,1988,1987,1986,1985,1984,1983,1982,1967,1966,1965
This statistics in other country:
Timeline:
This timeline shows a graph from 1965 to 2015 of Zimbabwe. No data until 1964. Number of actual observations by date: 37.
Source name:
World Development Indicators
Source organization:
World Bank staff estimates based data from International Monetary Fund's Direction of Trade database.
Categories, topics:
Private Sector, Trade
Last updated:
apr 23, 2017
Indicators value changes by year
Minimum:
17.173
jan 1, 1989
Maximum:
77.957
jan 1, 2007
At the date of observation
Value
Absolute change
Change from previous value
jan 1, 1965
32.462
+32.462
0.0%
jan 1, 1966
29.931
-2.531
-7.8%
jan 1, 1967
25.444
-4.487
-14.99%
jan 1, 1982
32.783
+7.339
28.85%
jan 1, 1983
30.251
-2.532
-7.72%
jan 1, 1984
32.416
+2.165
7.16%
jan 1, 1985
26.047
-6.369
-19.65%
jan 1, 1986
24.708
-1.338
-5.14%
jan 1, 1987
29.635
+4.927
19.94%
jan 1, 1988
29.603
-0.031
-0.11%
jan 1, 1989
17.173
-12.431
-41.99%
jan 1, 1990
31.488
+14.315
83.36%
jan 1, 1991
32.727
+1.239
3.93%
jan 1, 1992
30.696
-2.031
-6.21%
jan 1, 1993
28.521
-2.175
-7.09%
jan 1, 1994
32.053
+3.532
12.38%
jan 1, 1995
36.23
+4.177
13.03%
jan 1, 1996
42.794
+6.565
18.12%
jan 1, 1997
31.032
-11.762
-27.49%
jan 1, 1998
47.487
+16.455
53.03%
jan 1, 1999
42.409
-5.078
-10.69%
jan 1, 2000
45.985
+3.575
8.43%
jan 1, 2001
49.643
+3.659
7.96%
jan 1, 2002
62.26
+12.617
25.42%
jan 1, 2003
57.147
-5.114
-8.21%
jan 1, 2004
61.912
+4.765
8.34%
jan 1, 2005
63.957
+2.045
3.3%
jan 1, 2006
66.532
+2.575
4.03%
jan 1, 2007
77.957
+11.425
17.17%
jan 1, 2008
65.188
-12.769
-16.38%
jan 1, 2009
73.145
+7.956
12.21%
jan 1, 2010
74.103
+0.959
1.31%
jan 1, 2011
69.812
-4.291
-5.79%
jan 1, 2012
68.517
-1.295
-1.86%
jan 1, 2013
68.954
+0.437
0.64%
jan 1, 2014
67.155
-1.799
-2.61%
jan 1, 2015
65.527
-1.628
-2.42%
Ranking of countries by current statistics by years


Comments: