29
/
en
AIzaSyAYiBZKx7MnpbEhh9jyipgxe19OcubqV5w
April 1, 2024
65017
Albania
ALB
true
2
1
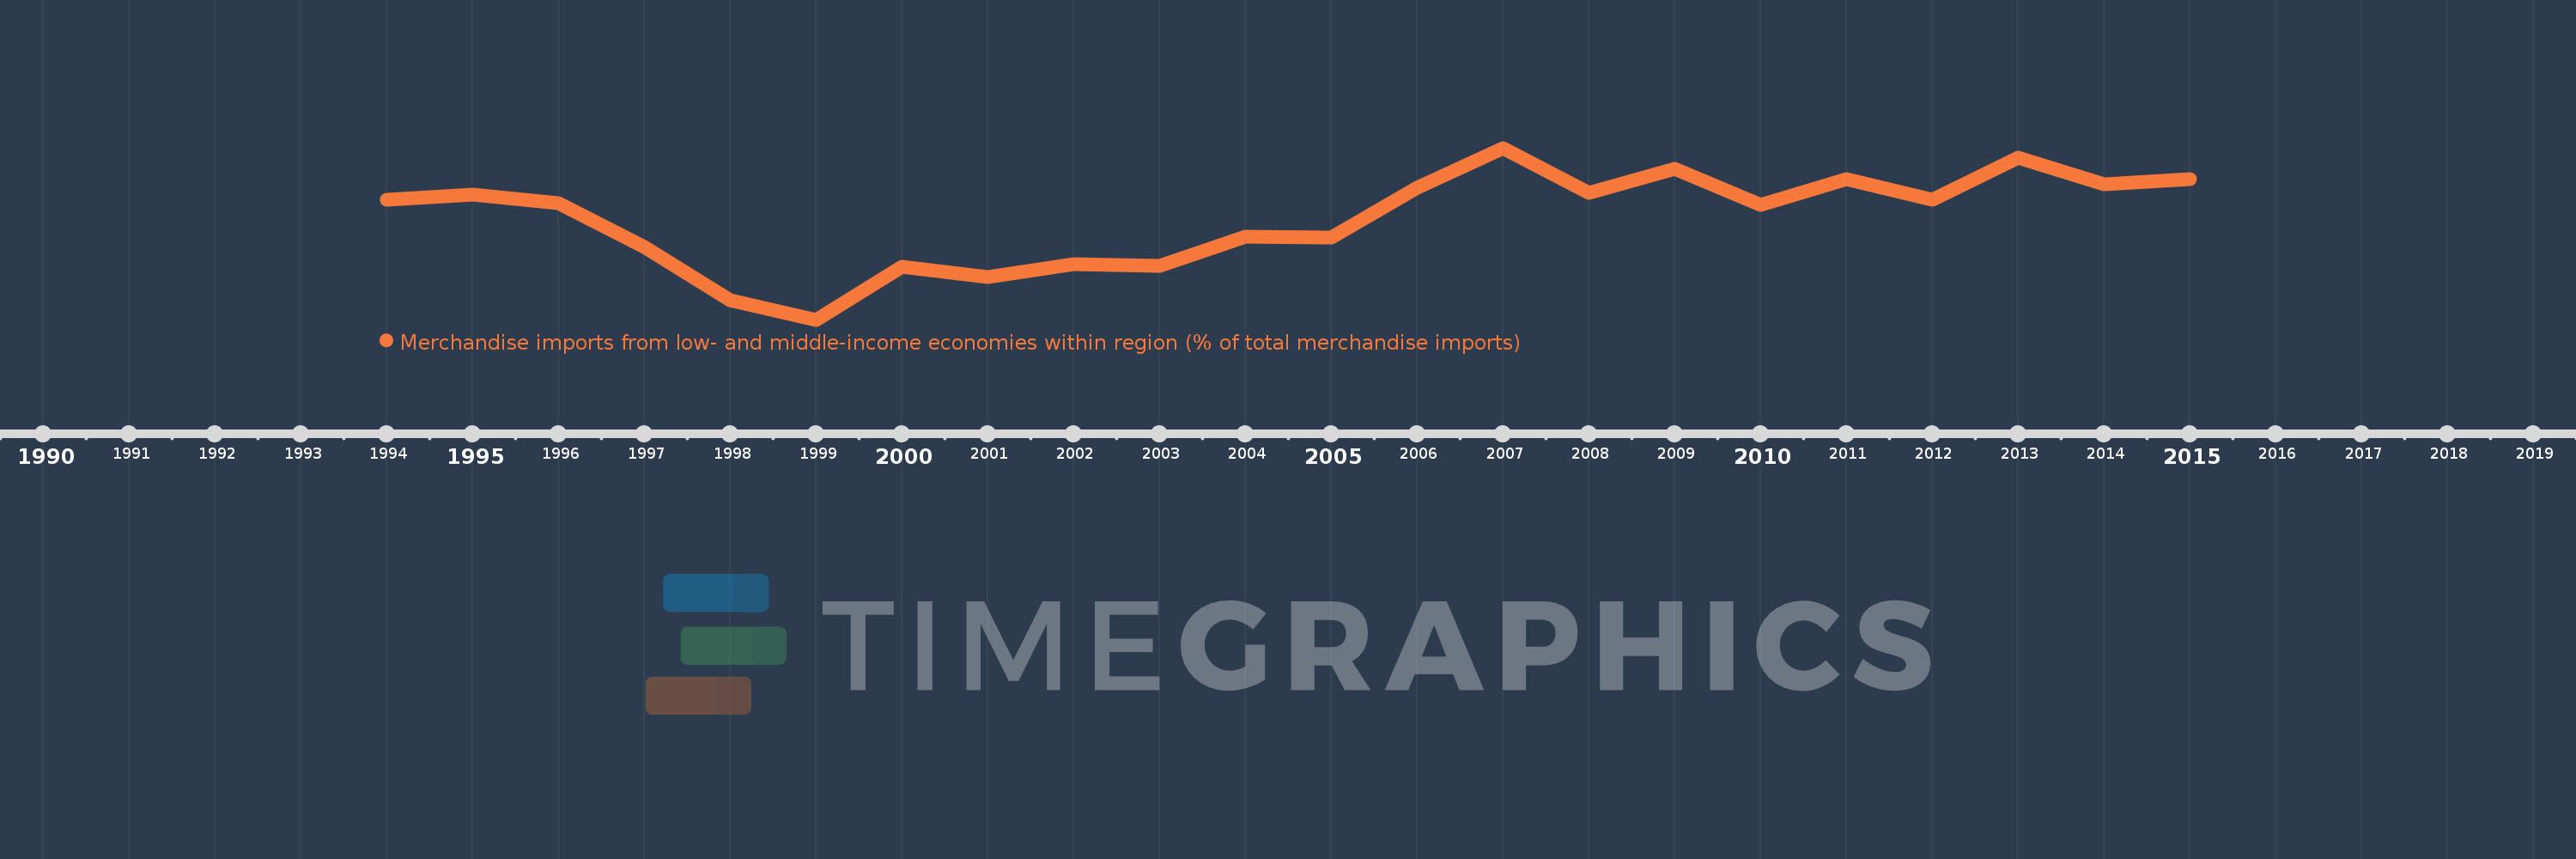
Merchandise imports from low- and middle-income economies within region (% of total merchandise imports)
2015,2014,2013,2012,2011,2010,2009,2008,2007,2006,2005,2004,2003,2002,2001,2000,1999,1998,1997,1996,1995,1994
This statistics in other country:
Timeline:
This timeline shows a graph from 1994 to 2015 of Albania. No data until 1993. Number of actual observations by date: 22.
Source name:
World Development Indicators
Source organization:
World Bank staff estimates based data from International Monetary Fund's Direction of Trade database.
Categories, topics:
Private Sector, Trade
Last updated:
apr 23, 2017
Indicators value changes by year
Maximum:
18.727
jan 1, 2007
At the date of observation
Value
Absolute change
Change from previous value
jan 1, 1994
15.769
+15.769
0.0%
jan 1, 1995
16.029
+0.261
1.65%
jan 1, 1996
15.574
-0.456
-2.84%
jan 1, 1997
13.022
-2.552
-16.39%
jan 1, 1998
9.978
-3.044
-23.37%
jan 1, 1999
8.857
-1.12
-11.23%
jan 1, 2000
11.894
+3.036
34.28%
jan 1, 2001
11.312
-0.581
-4.89%
jan 1, 2002
12.071
+0.759
6.71%
jan 1, 2003
11.954
-0.118
-0.97%
jan 1, 2004
13.632
+1.679
14.04%
jan 1, 2005
13.592
-0.04
-0.3%
jan 1, 2006
16.444
+2.852
20.98%
jan 1, 2007
18.727
+2.283
13.88%
jan 1, 2008
16.168
-2.559
-13.66%
jan 1, 2009
17.511
+1.343
8.31%
jan 1, 2010
15.446
-2.065
-11.79%
jan 1, 2011
16.951
+1.505
9.74%
jan 1, 2012
15.769
-1.182
-6.97%
jan 1, 2013
18.163
+2.395
15.19%
jan 1, 2014
16.629
-1.535
-8.45%
jan 1, 2015
16.912
+0.283
1.7%
Ranking of countries by current statistics by years


Comments: