29
/
en
AIzaSyAYiBZKx7MnpbEhh9jyipgxe19OcubqV5w
April 1, 2024
231333
Rwanda
RWA
true
2
1
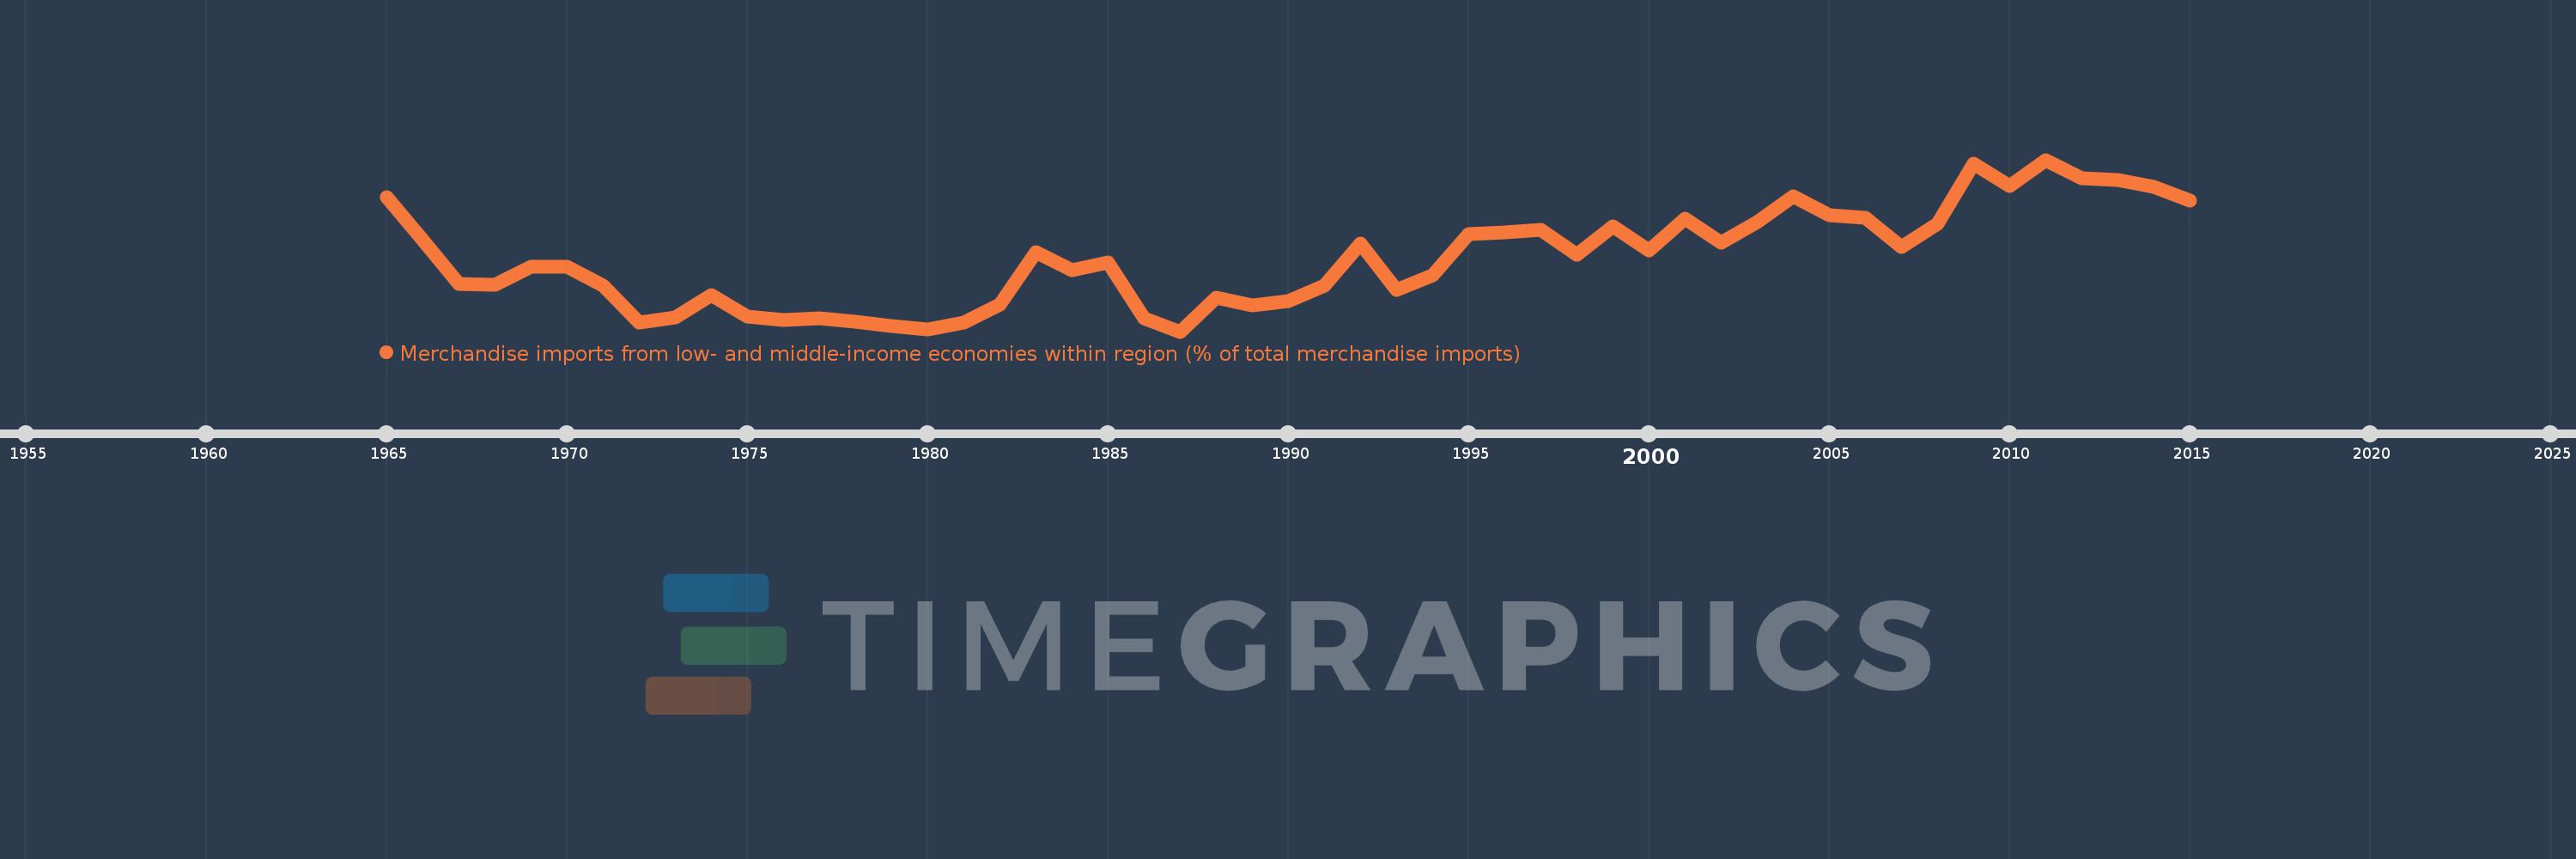
Merchandise imports from low- and middle-income economies within region (% of total merchandise imports)
2015,2014,2013,2012,2011,2010,2009,2008,2007,2006,2005,2004,2003,2002,2001,2000,1999,1998,1997,1996,1995,1994,1993,1992,1991,1990,1989,1988,1987,1986,1985,1984,1983,1982,1981,1980,1979,1978,1977,1976,1975,1974,1973,1972,1971,1970,1969,1968,1967,1966,1965
This statistics in other country:
Timeline:
This timeline shows a graph from 1965 to 2015 of Rwanda. No data until 1964. Number of actual observations by date: 51.
Source name:
World Development Indicators
Source organization:
World Bank staff estimates based data from International Monetary Fund's Direction of Trade database.
Categories, topics:
Private Sector, Trade
Last updated:
apr 23, 2017
Indicators value changes by year
Minimum:
12.415
jan 1, 1987
Maximum:
44.989
jan 1, 2011
At the date of observation
Value
Absolute change
Change from previous value
jan 1, 1965
37.931
+37.931
0.0%
jan 1, 1966
29.703
-8.228
-21.69%
jan 1, 1967
21.5
-8.203
-27.62%
jan 1, 1968
21.287
-0.213
-0.99%
jan 1, 1969
24.67
+3.382
15.89%
jan 1, 1970
24.786
+0.117
0.47%
jan 1, 1971
21.107
-3.679
-14.84%
jan 1, 1972
14.067
-7.04
-33.35%
jan 1, 1973
15.16
+1.093
7.77%
jan 1, 1974
19.261
+4.1
27.05%
jan 1, 1975
15.284
-3.976
-20.65%
jan 1, 1976
14.583
-0.701
-4.59%
jan 1, 1977
14.917
+0.335
2.29%
jan 1, 1978
14.335
-0.582
-3.9%
jan 1, 1979
13.544
-0.791
-5.51%
jan 1, 1980
12.901
-0.643
-4.75%
jan 1, 1981
14.112
+1.211
9.38%
jan 1, 1982
17.616
+3.504
24.83%
jan 1, 1983
27.556
+9.94
56.43%
jan 1, 1984
24.117
-3.439
-12.48%
jan 1, 1985
25.511
+1.393
5.78%
jan 1, 1986
14.939
-10.571
-41.44%
jan 1, 1987
12.415
-2.525
-16.9%
jan 1, 1988
18.864
+6.449
51.95%
jan 1, 1989
17.421
-1.442
-7.65%
jan 1, 1990
18.147
+0.725
4.16%
jan 1, 1991
21.065
+2.919
16.08%
jan 1, 1992
29.04
+7.974
37.86%
jan 1, 1993
20.303
-8.737
-30.09%
jan 1, 1994
23.077
+2.774
13.66%
jan 1, 1995
30.863
+7.786
33.74%
jan 1, 1996
31.198
+0.335
1.09%
jan 1, 1997
31.758
+0.56
1.79%
jan 1, 1998
26.912
-4.847
-15.26%
jan 1, 1999
32.44
+5.528
20.54%
jan 1, 2000
27.844
-4.596
-14.17%
jan 1, 2001
33.882
+6.038
21.69%
jan 1, 2002
29.204
-4.678
-13.81%
jan 1, 2003
33.227
+4.023
13.77%
jan 1, 2004
38.089
+4.863
14.63%
jan 1, 2005
34.494
-3.596
-9.44%
jan 1, 2006
33.965
-0.529
-1.53%
jan 1, 2007
28.438
-5.527
-16.27%
jan 1, 2008
32.827
+4.388
15.43%
jan 1, 2009
44.191
+11.365
34.62%
jan 1, 2010
39.948
-4.243
-9.6%
jan 1, 2011
44.989
+5.041
12.62%
jan 1, 2012
41.485
-3.505
-7.79%
jan 1, 2013
41.144
-0.34
-0.82%
jan 1, 2014
39.803
-1.341
-3.26%
jan 1, 2015
37.266
-2.537
-6.37%
Ranking of countries by current statistics by years


Comments: