29
/
en
AIzaSyAYiBZKx7MnpbEhh9jyipgxe19OcubqV5w
April 1, 2024
33649
European Union
EUU
false
2
1
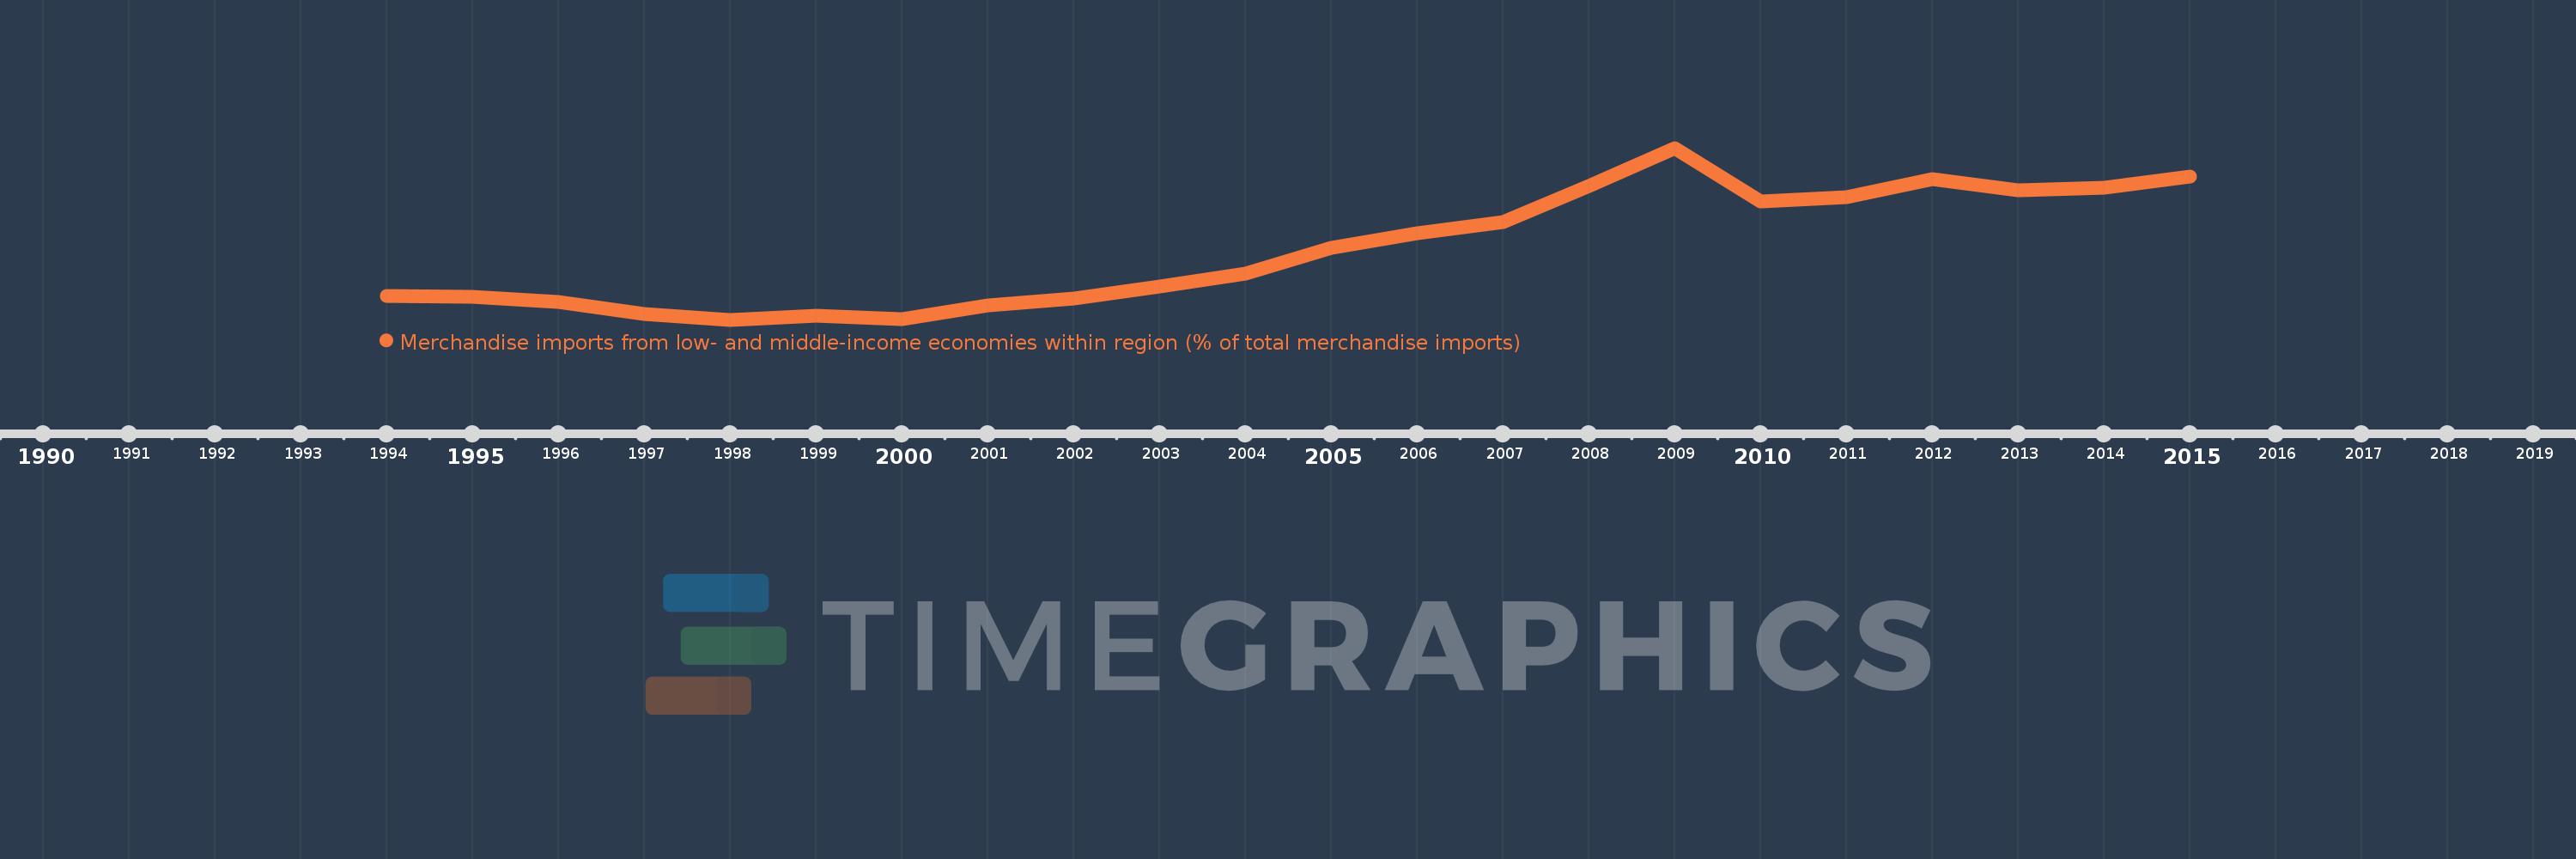
Merchandise imports from low- and middle-income economies within region (% of total merchandise imports)
2015,2014,2013,2012,2011,2010,2009,2008,2007,2006,2005,2004,2003,2002,2001,2000,1999,1998,1997,1996,1995,1994
This statistics in other country:
Timeline:
This timeline shows a graph from 1994 to 2015 of European Union. No data until 1993. Number of actual observations by date: 22.
Source name:
World Development Indicators
Source organization:
World Bank staff estimates based data from International Monetary Fund's Direction of Trade database.
Categories, topics:
Private Sector, Trade
Last updated:
apr 23, 2017
Indicators value changes by year
At the date of observation
Value
Absolute change
Change from previous value
jan 1, 1994
0.081
+0.081
0.0%
jan 1, 1995
0.079
-0.001
-1.48%
jan 1, 1996
0.072
-0.008
-9.58%
jan 1, 1997
0.052
-0.02
-27.69%
jan 1, 1998
0.043
-0.009
-16.45%
jan 1, 1999
0.05
+0.006
14.5%
jan 1, 2000
0.044
-0.006
-11.48%
jan 1, 2001
0.066
+0.022
50.47%
jan 1, 2002
0.077
+0.01
15.79%
jan 1, 2003
0.096
+0.019
24.7%
jan 1, 2004
0.117
+0.022
22.66%
jan 1, 2005
0.157
+0.04
34.22%
jan 1, 2006
0.181
+0.024
14.93%
jan 1, 2007
0.199
+0.018
10.14%
jan 1, 2008
0.256
+0.057
28.72%
jan 1, 2009
0.317
+0.06
23.59%
jan 1, 2010
0.231
-0.086
-27.23%
jan 1, 2011
0.239
+0.008
3.64%
jan 1, 2012
0.267
+0.028
11.89%
jan 1, 2013
0.249
-0.019
-7.08%
jan 1, 2014
0.254
+0.006
2.35%
jan 1, 2015
0.271
+0.016
6.47%
Ranking of countries by current statistics by years


Comments: