29
/
en
AIzaSyAYiBZKx7MnpbEhh9jyipgxe19OcubqV5w
April 1, 2024
239570
Sierra Leone
SLE
true
2
1
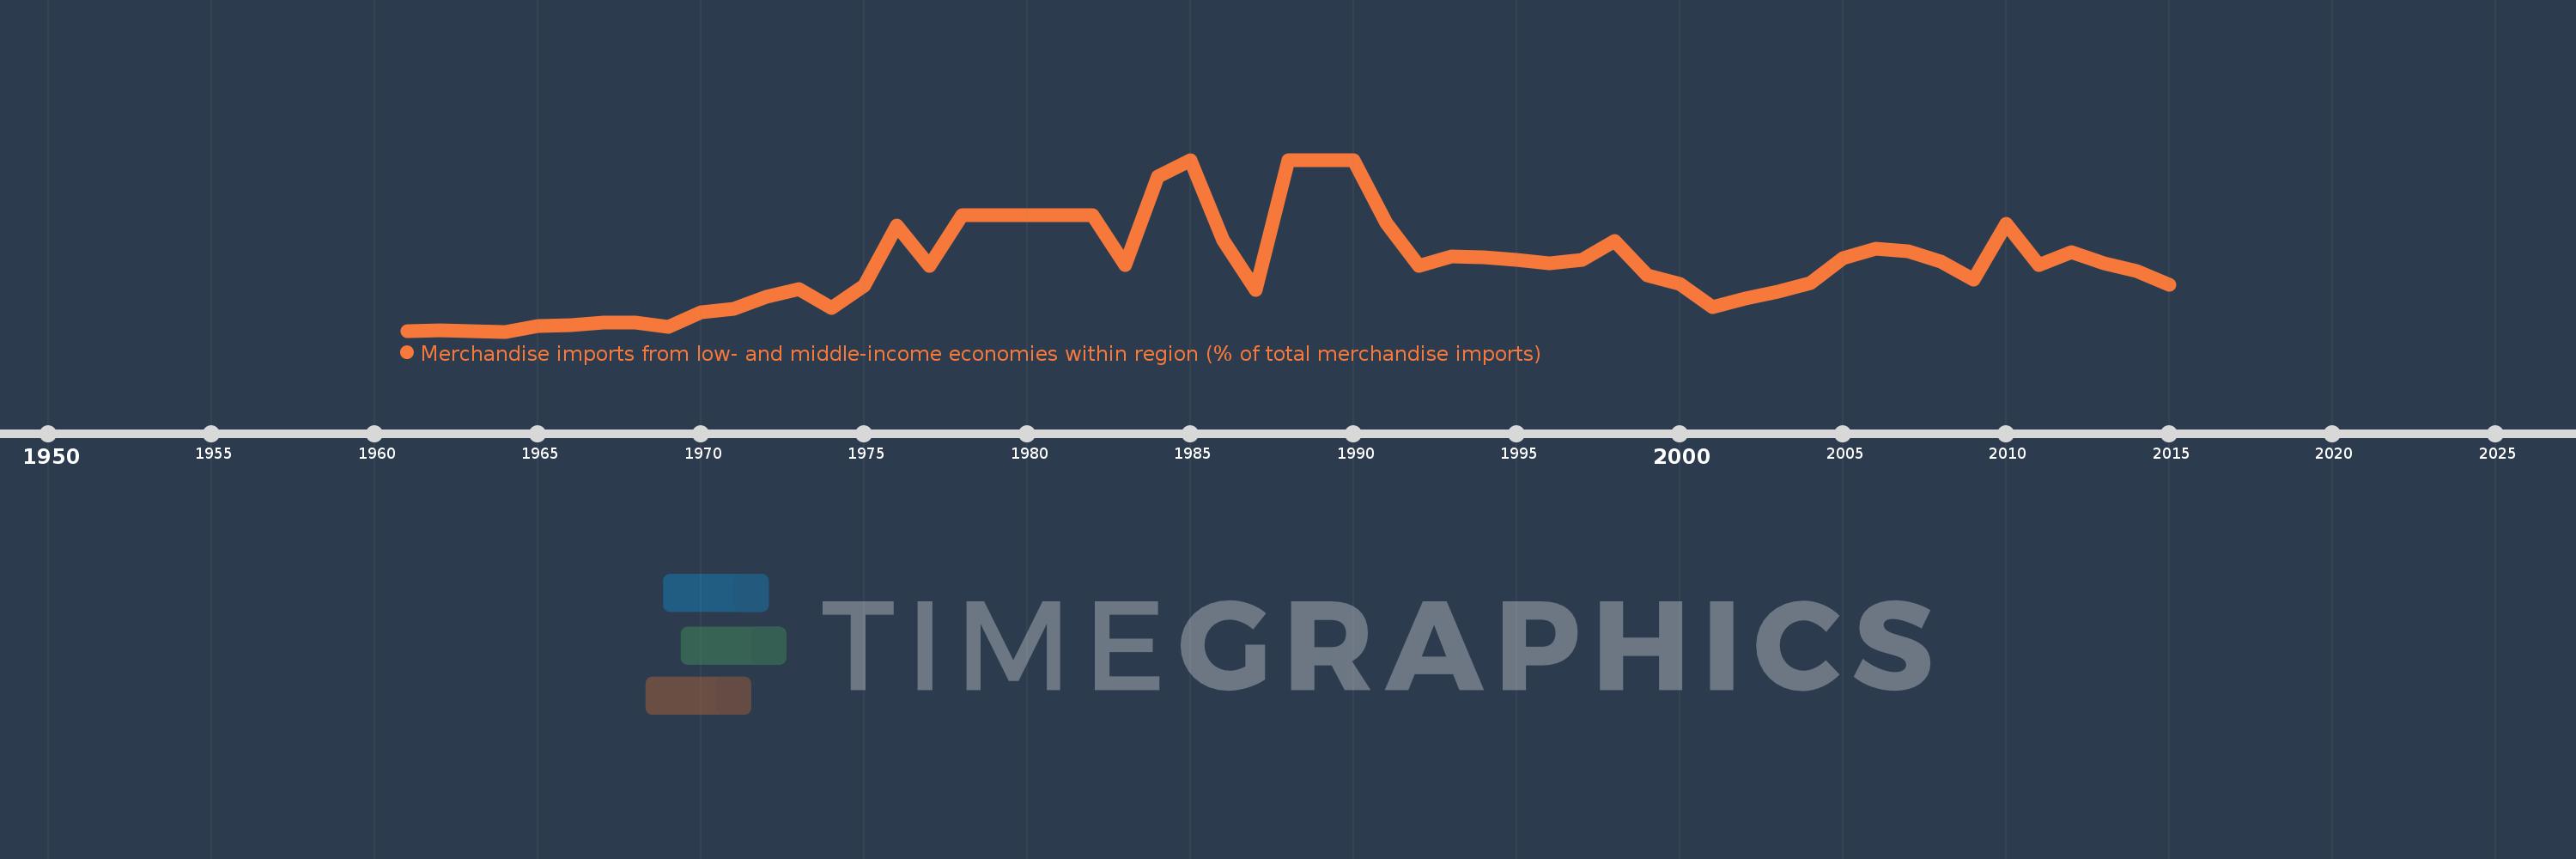
Merchandise imports from low- and middle-income economies within region (% of total merchandise imports)
2015,2014,2013,2012,2011,2010,2009,2008,2007,2006,2005,2004,2003,2002,2001,2000,1999,1998,1997,1996,1995,1994,1993,1992,1991,1990,1989,1988,1987,1986,1985,1984,1983,1982,1978,1977,1976,1975,1974,1973,1972,1971,1970,1969,1968,1967,1966,1965,1964,1963,1962,1961
This statistics in other country:
Timeline:
This timeline shows a graph from 1961 to 2015 of Sierra Leone. No data until 1960. Number of actual observations by date: 52.
Source name:
World Development Indicators
Source organization:
World Bank staff estimates based data from International Monetary Fund's Direction of Trade database.
Categories, topics:
Private Sector, Trade
Last updated:
apr 23, 2017
Indicators value changes by year
Maximum:
37.931
jan 1, 1989
At the date of observation
Value
Absolute change
Change from previous value
jan 1, 1961
1.24
+1.24
0.0%
jan 1, 1962
1.446
+0.206
16.65%
jan 1, 1963
1.198
-0.248
-17.18%
jan 1, 1964
1.084
-0.113
-9.46%
jan 1, 1965
2.307
+1.223
112.75%
jan 1, 1966
2.421
+0.114
4.94%
jan 1, 1967
3.0
+0.579
23.92%
jan 1, 1968
3.01
+0.01
0.33%
jan 1, 1969
2.011
-0.999
-33.18%
jan 1, 1970
5.296
+3.285
163.35%
jan 1, 1971
5.894
+0.598
11.29%
jan 1, 1972
8.604
+2.709
45.97%
jan 1, 1973
10.284
+1.681
19.53%
jan 1, 1974
6.137
-4.148
-40.33%
jan 1, 1975
10.977
+4.84
78.87%
jan 1, 1976
23.858
+12.882
117.36%
jan 1, 1977
15.203
-8.656
-36.28%
jan 1, 1978
26.004
+10.801
71.05%
jan 1, 1982
26.004
+0.0
0.0%
jan 1, 1983
15.341
-10.662
-41.0%
jan 1, 1984
34.4
+19.059
124.23%
jan 1, 1985
37.931
+3.53
10.26%
jan 1, 1986
20.688
-17.243
-45.46%
jan 1, 1987
10.105
-10.583
-51.16%
jan 1, 1988
37.931
+27.826
275.37%
jan 1, 1989
37.931
+0.0
0.0%
jan 1, 1990
37.931
0.0
0.0%
jan 1, 1991
24.422
-13.509
-35.61%
jan 1, 1992
15.223
-9.199
-37.67%
jan 1, 1993
17.187
+1.964
12.9%
jan 1, 1994
16.929
-0.258
-1.5%
jan 1, 1995
16.513
-0.416
-2.46%
jan 1, 1996
15.818
-0.695
-4.21%
jan 1, 1997
16.442
+0.624
3.95%
jan 1, 1998
20.446
+4.005
24.36%
jan 1, 1999
13.089
-7.357
-35.98%
jan 1, 2000
11.39
-1.699
-12.98%
jan 1, 2001
6.41
-4.98
-43.72%
jan 1, 2002
8.085
+1.675
26.13%
jan 1, 2003
9.559
+1.474
18.23%
jan 1, 2004
11.422
+1.863
19.49%
jan 1, 2005
16.879
+5.457
47.78%
jan 1, 2006
18.841
+1.962
11.62%
jan 1, 2007
18.228
-0.613
-3.25%
jan 1, 2008
16.074
-2.154
-11.82%
jan 1, 2009
12.268
-3.806
-23.68%
jan 1, 2010
24.141
+11.873
96.79%
jan 1, 2011
15.338
-8.803
-36.47%
jan 1, 2012
18.07
+2.732
17.81%
jan 1, 2013
15.652
-2.417
-13.38%
jan 1, 2014
14.044
-1.609
-10.28%
jan 1, 2015
11.19
-2.854
-20.32%
Ranking of countries by current statistics by years


Comments: